illegal aliens

Oregon’s Clackamas County Fourth in Foreign National Crime in May 2019

On May 1, 2019 Oregon’s Clackamas County had 75 of the 910 foreign nationals (criminal aliens) incarcerated in the Oregon Department of Corrections (DOC) prison system; the county was fourth in foreign national crime in the state with 8.24 percent of the criminal aliens in DOC prisons.

The following table reveals how Clackamas County residents were harmed or victimized by the 75 criminal aliens incarcerated on May 1st in the DOC prison system with U.S. Immigration and Customs Enforcement (ICE) ICE detainers.
 

OREGON DEPARTMENT OF CORRECTIONS

Crime

Total Number of Inmates W/ ICE Detainers in DOC Prisons from Clackamas County by Type of Crime

Percentage of Inmates W/ICE Detainers in DOC Prisons from Clackamas County by Type of Crime

Drugs

15

20.00%

Rape

9

12.00%

Sex Abuse

9

12.00%

Homicide

7

9.33%

Sodomy

6

8.00%

Theft

5

6.67%

Robbery

4

5.33%

Kidnapping

3

4.00%

Assault

2

2.67%

Arson

0

0.00%

Burglary

0

0.00%

Driving Offense

0

0.00%

Escape

0

0.00%

Forgery

0

0.00%

Vehicle Theft

0

0.00%

Other / Combination Crimes

15

20.00%

Total

75

100.00%

Source: Research and Evaluation DOC Report ICE inmates list 01 May 19.

This table reveals, using the DOC ICE detainer numbers from May 1st, the total number of criminal alien inmates incarcerated in the DOC prison system by type of crime from all Oregon counties, the total number of criminal alien inmates from Clackamas County in DOC prisons by type of crime and the percentage of those alien inmates who were from the county by type of crime.
 

OREGON DEPARTMENT OF CORRECTIONS

Crime

Total number of Inmates W/ ICE Detainers in DOC Prisons from all Oregon Counties by Type of Crime


Percentage of Inmates W/ICE Detainers in DOC Prisons from Clackamas County by Type of Crime

Sex Abuse

183

9

4.92%

Rape

172

9

5.23%

Homicide

131

7

5.34%

Sodomy

100

6

6.00%

Assault

85

2

2.35%

Drugs

81

15

18.52%

Robbery

45

4

8.89%

Kidnapping

26

3

11.54%

Burglary

18

0

0.00%

Theft

16

5

31.25%

Driving Offense

4

0

0.00%

Vehicle Theft

2

0

0.00%

Arson

0

0

0.00%

Escape

0

0

0.00%

Forgery

0

0

0.00%

Other / Comb. Crimes

47

15

31.91%

Total

910

75


Source: Research and Evaluation DOC Report ICE inmates list 01 May 19.

Criminal aliens from 10 identified countries have harmed or victimized Clackamas County residents.

Foreign nationals who declared their country or origin as being Mexico were 61 of 75 criminal aliens from Clackamas County incarcerated in the DOC prison system — 81.33 percent of the county’s alien inmates in the state’s prisons.

The following table reveals the self-declared countries of origin of the majority of the 75 criminal aliens with ICE detainers who have harmed or victimized the residents of Clackamas County in the DOC prison system.
 

OREGON DEPARTMENT OF CORRECTIONS

Country

Total Inmates W/ ICE Detainers from Clackamas County by Country of Origin in DOC Prisons

Percentage of Inmates W/ICE Detainers by Country of Origin from Clackamas County in DOC Prisons

Mexico

61

81.33%

China

3

4.00%

Cuba

2

2.67%

Honduras

2

2.67%

Other Countries

7

9.33%

Total

75

100.00%

Source: Research and Evaluation DOC Report ICE inmates list 01 May 19.

David Olen Cross of Salem, Oregon is crime researcher who writes on immigration issues and foreign national crime. The preceding report is a service to Oregon state, county and city governmental officials to help them assess the impact of foreign national crime in the state. He can be reached at docfnc@yahoo.com. His past crime reports can be found at http://docfnc.wordpress.com/. Read more about Oregon’s Clackamas County Fourth in Foreign National Crime in May 2019

Oregon Department of Corrections: Criminal Alien Report for Recalcitrant Countries May 2019

Information obtained from the Oregon Department of Corrections (DOC) on May 1, 2019 reveals that 56 of the 910 foreign nationals (criminal aliens) in the state’s prison system were from current designated “at risk of non-compliance” or “recalcitrant / uncooperative” countries that may not take back their own criminal citizens after they are released from DOC prisons and turned over to U.S. Immigration and Customs Enforcement (ICE) for possible removal from the United States of America (USA) — 6.15 percent of the criminal alien prison population (Note: The names of recalcitrant countries that may not take back their own criminal citizens has been in a state of flux in recent years.).

Some background information, all 56 criminal aliens incarcerated in the DOC prison system from current designated “at risk of non-compliance” or “recalcitrant / uncooperative” countries were identified by ICE and have immigration detainers placed on them.

Criminal aliens from 15 current designated “at risk of non-compliance” or “recalcitrant / uncooperative” countries were incarcerated in the DOC prison system on May 1, 2019:

Thailand (three criminal aliens), Egypt (two criminal aliens), Ethiopia (two criminal aliens), Sierra Leone (two criminal aliens), Bhutan (one criminal alien), Brazil (one criminal alien), Iraq (one criminal alien), Nigeria (one criminal alien) and Sudan (one criminal alien) were the nine current designated “at risk of non-compliance” (ARNC) countries;

Cuba (16 criminal aliens), Vietnam (12 criminal aliens), Laos (six criminal aliens), Cambodia (four criminal aliens), China (three criminal aliens) and Burma (one criminal alien) were the six current designated “recalcitrant / uncooperative” (RUC) countries.

Using DOC ICE detainer numbers, the following table reveals the self-declared countries of origin of the 56 criminal alien inmates from current designated “at risk of non-compliance” or “recalcitrant / uncooperative” countries by number and percentage incarcerated on May 1st in the state’s prisons.
 

OREGON DEPARTMENT OF CORRECTIONS

Country:
– At Risk of Non-Compliance (ARNC)
– Recalcitrant / Uncooperative Countries (RUC)

DOC Total Number of Inmates W/ICE Detainers by Self-Declared Country of Origin from Current At Risk of Non-Compliance or Recalcitrant / Uncooperative Countries

DOC Percent Inmates W/ICE Detainers by Self-Declared Country of Origin from Current At Risk of Non-Compliance or Recalcitrant / Uncooperative Countries

Cuba (RUC)

16

28.57%

Vietnam (RUC)

12

21.43%

Laos (RUC)

6

10.71%

Cambodia (RUC)

4

7.14%

China (RUC)

3

5.36%

Thailand (ARNC)

3

5.36%

Egypt (ARNC)

2

3.57%

Ethiopia (ARNC)

2

3.57%

Sierra Leone (ARNC)

2

3.57%

Bhutan (ARNC)

1

1.79%

Burma (RUC)

1

1.79%

Brazil (ARNC)

1

1.79%

Iraq (ARNC)

1

1.79%

Nigeria (ARNC)

1

1.79%

Sudan (ARNC)

1

1.79%

Total

56

100.00%

Source: Research and Evaluation DOC Report ICE inmates list 01 May 19.

Here are the ways Oregon residents were victimized by the 56 criminal aliens from current designated “at risk of non-compliance” or “recalcitrant / uncooperative” countries.

Significant numbers, there were 33 of the 56 criminal alien inmates from current designated “at risk of non-compliance” or “recalcitrant / uncooperative” countries incarcerated in DOC prisons for violent crimes — homicide, rape, assault, sex abuse, sodomy and kidnapping — 58.93 percent of the alien inmates from “at risk of non-compliance” or “recalcitrant / uncooperative” countries.

Using DOC ICE detainer numbers, the following table reveals the number and percentage of criminal alien inmates from current designated “at risk of non-compliance” or “recalcitrant / uncooperative” countries incarcerated on May 1st by type of crime.
 

OREGON DEPARTMENT OF CORRECTIONS

Crime

Total Number of Inmates W/ ICE Detainers by Type of Crime from Current At Risk of Non-Compliance or Recalcitrant / Uncooperative Countries

DOC Percent of  Inmates W/ICE Detainers by Type of Crime from Current At Risk of Non-Compliance or Recalcitrant / Uncooperative Countries

Homicide

12

21.43%

Theft

10

17.86%

Rape

8

14.29%

Robbery

7

12.50%

Assault

5

8.93%

Sex Abuse

4

7.14%

Burglary

3

5.36%

Sodomy

3

5.36%

Drugs

2

3.57%

Kidnapping

1

1.79%

Vehicle Theft

0

0.00%

Arson

0

0.00%

Driving Offense

0

0.00%

Escape

0

0.00%

Forgery

0

0.00%

Other / Combination Crimes

1

1.79%

Total

56

100.00%

Source: Research and Evaluation DOC Report ICE inmates list 01 May 19.

Criminal aliens from current designated “at risk of non-compliance” or “recalcitrant / uncooperative” countries incarcerated in DOC prisons committed at least one crime in 10 of 36 Oregon counties — 27.78 percent of the counties in the state.

Using DOC ICE detainer numbers, the following table reveals the number and percentage of criminal alien inmates from current designated “at risk of non-compliance” or “recalcitrant / uncooperative” countries incarcerated on May 1st that weresent to prison from the state’s 36 counties.
 

OREGON DEPARTMENT OF CORRECTIONS

County

DOC Total Number of  Inmates W/ ICE Detainers by County from Current At Risk of Non-Compliance or Recalcitrant / Uncooperative Countries

DOC Percent of Inmates W/ICE Detainers by County from Current At Risk of Non-Compliance or Recalcitrant / Uncooperative Countries

Multnomah

28

50.00%

Washington

8

14.29%

Clackamas

6

10.71%

Marion

6

10.71%

Lane

2

3.57%

Clatsop

1

1.79%

Jackson

1

1.79%

Klamath

1

1.79%

Lincoln

1

1.79%

Linn

1

1.79%

OSS (Not a County)

1

1.79%

Baker

0

0.00%

Benton

0

0.00%

Columbia

0

0.00%

Coos

0

0.00%

Crook

0

0.00%

Curry

0

0.00%

Deschutes

0

0.00%

Douglas

0

0.00%

Gilliam

0

0.00%

Grant

0

0.00%

Harney

0

0.00%

Hood River

0

0.00%

Jefferson

0

0.00%

Josephine

0

0.00%

Lake

0

0.00%

Malheur

0

0.00%

Morrow

0

0.00%

Polk

0

0.00%

Sherman

0

0.00%

Tillamook

0

0.00%

Umatilla

0

0.00%

Union

0

0.00%

Wallowa

0

0.00%

Wasco

0

0.00%

Wheeler

0

0.00%

Yamhill

0

0.00%

Total

56

100.00%

Source: Research and Evaluation DOC Report ICE inmates list 01 May 19.

Beyond the DOC criminal alien incarceration numbers and percentages by countries of origin, by crime types or by the state’s counties, criminal aliens from current designated “at risk of non-compliance” or “recalcitrant / uncooperative” countries pose a significant economic cost to Oregon tax payers.

An individual inmate incarcerated in the DOC prison system costs the state approximately ($108.26) per day.

The DOC’s incarceration cost for its 56 criminal alien prison population from current designated “at risk of non-compliance” or “recalcitrant / uncooperative” countries is approximately ($6,062.56) per day, ($42,437.92) per week, and ($2,212,834.40) per year.

None of preceding cost estimates for the DOC to incarcerate the 56 criminal aliens from current designated “at risk of non-compliance” or “recalcitrant / uncooperative” countries includes the dollar amount for legal services (indigent defense), language interpreters, court costs, or victim assistance.

Bibliography:

Oregon Department of Corrections Population Profile (unpublished MS Excel workbook) titled Incarcerated Criminal Aliens Report dated May 1, 2019.

Oregon Department of Corrections Issue Brief Quick Facts, March 2019: https://www.oregon.gov/doc/Documents/agency-quick-facts.pdf

David Olen Cross of Salem, Oregon is crime researcher who writes on immigration issues and foreign national crime. The preceding report is a service to federal, state, county and city elected and non elected governmental officials to help them assess the impact of foreign national crime in the United States of America. He can be reached at docfnc@yahoo.com. His past crime reports can be found at http://docfnc.wordpress.com/. Read more about Oregon Department of Corrections: Criminal Alien Report for Recalcitrant Countries May 2019

Oregon Department of Corrections: Foreign National Drug Crime Report May 2019

Information obtained from the Oregon Department of Corrections (DOC) indicated on May 1, 2019 revealed that 81 of the 910 foreign nationals (criminal aliens) in the state’s prison system were incarcerated for drug crimes — 8.90 percent of the criminal alien prison population.

Using DOC U.S. Immigration and Customs Enforcement (ICE) ICE detainer numbers, the following table reveals the total number criminal alien inmates in the DOC prison system along with the number and percentage of those alien inmates incarcerated on May 1st in the state’s prisons for drug crimes.
 

OREGON DEPARTMENT OF CORRECTIONS

Month/Day/Year

DOC Total Inmates W/ICE Detainers

DOC Number of Inmates W/ICE Detainers for Drug Crimes

DOC Percent of Inmates W/ICE Detainers for Drug Crimes

May 1, 2019

910

81

8.90%

Source: Research and Evaluation DOC Report ICE inmates list 01 May 19.

The 81 criminal aliens in the DOC prison system incarcerated for drug crimes were 8.92 percent of all inmates, domestic and foreign, in the state’s prisons for drug crimes.

Using the DOC Inmate Population Profile and ICE immigration detainer numbers from May 1st, the following table reveals the total number inmates incarcerated for drug crimes, the number of domestic and criminal alien inmates incarcerated for drug crimes and the percentage drug crimes committed by criminal aliens.
 

OREGON DEPARTMENT OF CORRECTIONS

Month/Day/Year

DOC Total Number of Inmates Incarcerated for Drug Crimes

DOC Number of Domestic Inmates Incarcerated for Drug Crimes

DOC Number of Inmates W/ICE Detainers Incarcerated for Drug Crimes

DOC Inmates W/ICE Detainers as a Percentage of All Inmates incarcerated for Drug Crimes

May 1, 2019

908

827

81

8.92%

Source: Research and Evaluation DOC Report ICE inmates list 01 May 19 and Inmate Population Profile 01 May 19.

Criminal aliens were incarcerated in DOC prisons for drug crimes from 19 of 36 Oregon counties — 52.78 percent of the counties in the state.

Five Oregon counties, Multnomah (19 alien drug criminals), Clackamas (15 alien drug criminals), Washington (13 alien drug criminals), Jackson (7 alien drug criminals) and Marion (6 alien drug criminals) had 60 of 81 criminal alien inmates incarcerated in DOC prisons for the drug crimes — 74.07 percent of the alien inmates incarcerated for drug crimes.

Using DOC ICE immigration detainer numbers, the following table reveals the number and percentage of criminal alien inmates incarcerated on May 1st that were sent to prison from the state’s 36 counties for drug crimes.
 

OREGON DEPARTMENT OF CORRECTIONS

County

DOC Number of Inmates W/ ICE Detainers by County Incarcerated for Drug Crimes

DOC Percent of Inmates W/ ICE Detainers by County Incarcerated for Drug Crimes

Multnomah

19

23.46%

Clackamas

15

18.52%

Washington

13

16.05%

Jackson

7

8.64%

Marion

6

7.41%

Lane

3

3.70%

Umatilla

3

3.70%

Jefferson

2

2.47%

Malheur

2

2.47%

Wasco

2

2.47%

Baker

1

1.23%

Benton

1

1.23%

Deschutes

1

1.23%

Josephine

1

1.23%

Klamath

1

1.23%

Lake

1

1.23%

Polk

1

1.23%

Union

1

1.23%

Yamhill

1

1.23%

Clatsop

0

0.00%

Columbia

0

0.00%

Coos

0

0.00%

Crook

0

0.00%

Curry

0

0.00%

Douglas

0

0.00%

Gilliam

0

0.00%

Grant

0

0.00%

Harney

0

0.00%

Hood River

0

0.00%

Lincoln

0

0.00%

Linn

0

0.00%

Morrow

0

0.00%

OOS (Not a County)

0

0.00%

Sherman

0

0.00%

Tillamook

0

0.00%

Wallowa

0

0.00%

Wheeler

0

0.00%

Total

81

100.00%

Source: Research and Evaluation DOC Report ICE inmates list 01 May 19

Criminal aliens from five identified countries were incarcerated in DOC prisons for drug crimes.

Foreign nationals who declared their country or origin as being Mexico were 75 of 81 criminal aliens convicted of drug crimes incarcerated in the DOC prison system — 92.59 percent of the alien drug criminals in the state’s prisons.

Using DOC ICE immigration detainer numbers, the following table reveals the self-declared countries of origin of the 81 criminal alien inmates by number and percentage incarcerated on May 1st in the state’s prisons for drug crimes.
 

OREGON DEPARTMENT OF CORRECTIONS

Country

DOC Number of Inmates W/ ICE Detainers by Country Incarcerated for Drug Crimes

DOC Percent of Inmates W/ ICE Detainers by Country Incarcerated for Drug Crimes


Mexico

75

92.59%


Cuba

1

1.23%


Honduras

1

1.23%


Italy

1

1.23%


Laos

1

1.23%


Unknown Countries

2

2.47%


Total

81

100.00%


Source: Research and Evaluation DOC Report ICE inmates list 01 May 19.

David Olen Cross of Salem, Oregon is a crime researcher who writes on immigration issues and foreign national crime. The preceding report is a service to federal, state, county and city elected and non elected governmental officials to help them assess the impact of foreign national crime in the United States of America. He can be reached at docfnc@yahoo.com. His past crime reports can be found at http://docfnc.wordpress.com/.


  Read more about Oregon Department of Corrections: Foreign National Drug Crime Report May 2019

Oregon Department of Corrections: Foreign National Sex Crime Report May 2019

Information obtained from the Oregon Department of Corrections (DOC) indicated on May 1, 2019 that 455 of 910 foreign nationals (criminal aliens) in the state’s prison system were incarcerated for three types of sex crimes — sex abuse, rape and sodomy — 50.00 percent of the criminal alien prison population (Note: The number of criminal aliens incarcerated for sex crimes in DOC prisons does not necessarily equal the number of Oregon residents victimized by alien sex abuse, rape and sodomy.).

Using DOC U.S. Immigration and Customs Enforcement (ICE) immigration detainer numbers, the following table is a numerical breakdown by number and percentage of the 455 criminal alien inmates incarcerated on May 1st in the state’s prisons for the crimes of sex abuse, rape and sodomy.
 

OREGON DEPARTMENT OF CORRECTIONS

Crime

DOC Number Inmates W/ ICE Detainers Incarcerated by Type of Sex Crime

DOC Percent Inmates W/ICE Detainers Incarcerated by Type of Sex Crime

Sex Abuse

183

40.22%

Rape

172

37.80%

Sodomy

100

21.98%

Total

455

100.00%

Source: Research and Evaluation DOC Report ICE inmates list 01 May 19.

Criminal aliens incarcerated in DOC prisons committed at least one sex crime in 26 of 36 Oregon counties — 72.22 percent of the counties in the state.

Seven Oregon counties, Marion (125 alien sex offenders), Washington (112 alien sex offenders), Multnomah (73 alien sex offenders), Lane (26 alien sex offenders), Clackamas (24 alien sex offenders), Jackson (15 alien sex offenders) and Yamhill (14 alien sex offenders) had 390 of 455 criminal alien inmates incarcerated in DOC prisons for sex crimes — 85.71 percent of the alien sex offenders incarcerated in the state’s prisons.

Using DOC ICE detainer numbers, the following table indicates the location by county of where the 455 criminal alien inmates were sent to serve time in the state’s prison system for sex crimes; furthermore, the table is a numerical breakdown by county of the type of sex crimes alien inmates committed that got them sent to the state’s prison system; finally, the table gives the total number and percentage of alien inmates by county incarcerated for sex crimes in the state’s prison system.
 

OREGON DEPARTMENT OF CORRECTIONS

County

DOC Number Inmates W/ ICE Detainers by County Incarcerated for the Crime of Sex Abuse

DOC Number Inmates W/ICE Detainers by County Incarcerated for the Crime of Rape

DOC Number Inmates W/ICE Detainers by County Incarcerated for the Crime of Sodomy

DOC Number Inmates W/ICE Detainers by County Incarcerated for Sex Crimes

DOC Percent Inmates W/ICE Detainers by County Incarcerated for Sex Crimes

Marion

44

49

32

125

27.47%

Washington

45

46

21

112

24.62%

Multnomah

33

24

16

73

16.04%

Lane

8

12

6

26

5.71%

Clackamas

9

9

6

24

5.27%

Jackson

7

4

4

15

3.30%

Yamhill

3

6

5

14

3.08%

Deschutes

5

2

1

8

1.76%

Linn

6

1

1

8

1.76%

Umatilla

3

2

2

7

1.54%

Benton

0

4

1

5

1.10%

Malheur

3

2

0

5

1.10%

Polk

3

1

1

5

1.10%

Clatsop

2

1

0

3

0.66%

Coos

0

2

1

3

0.66%

Klamath

3

0

0

3

0.66%

Lincoln

2

1

0

3

0.66%

Wasco

1

2

0

3

0.66%

Hood River

0

2

0

2

0.44%

Jefferson

1

1

0

2

0.44%

Josephine

2

0

0

2

0.44%

Morrow

1

1

0

2

0.44%

Tillamook

1

0

1

2

0.44%

Crook

0

0

1

1

0.22%

Douglas

0

0

1

1

0.22%

Union

1

0

0

1

0.22%

Baker

0

0

0

0

0.00%

Columbia

0

0

0

0

0.00%

Curry

0

0

0

0

0.00%

Gilliam

0

0

0

0

0.00%

Grant

0

0

0

0

0.00%

Harney

0

0

0

0

0.00%

Lake

0

0

0

0

0.00%

OOS

0

0

0

0

0.00%

Sherman

0

0

0

0

0.00%

Wallowa

0

0

0

0

0.00%

Wheeler

0

0

0

0

0.00%

Total

183

172

100

455

100.00%

Source: Research and Evaluation DOC Report ICE inmates list 01 May 19.

Criminal aliens from 36 identified countries were incarcerated in DOC prisons for sex crimes in the State of Oregon.

Foreign nationals who declared their country or origin as being Mexico were 380 of 455 criminal alien inmates incarcerated for sex crimes in the DOC prison system — 83.52 percent of the alien sex offenders in the state’s prisons.

Using DOC ICE detainer numbers, the following table indicates the self-declared countries of origin of the 455 criminal alien inmates that were sent to serve time in the state’s prison system for sex crimes; furthermore, the table is a numerical breakdown by country of the type of sex crimes alien inmates committed that got them sent to the state’s prison system; finally, the table gives the total number and percentage of alien inmates by country incarcerated for sex crimes in the state’s prison system.
 

OREGON DEPARTMENT OF CORRECTIONS

Country

DOC Number Inmates W/ ICE Detainers by Country Incarcerated for the Crime of Sex Abuse

DOC Number Inmates W/ICE Detainers by Country Incarcerated for the Crime of Rape

DOC Number Inmates W/ICE Detainers by Country Incarcerated for the Crime of Sodomy

DOC Number Inmates W/ICE Detainers by Country Incarcerated for Sex Crimes

DOC Percent Inmates W/ICE Detainers by Country Incarcerated for Sex Crimes

Mexico

161

140

79

380

83.52%

Guatemala

5

6

2

13

2.86%

El Salvador

1

2

5

8

1.76%

Russia

0

3

1

4

0.88%

Vietnam

0

3

1

4

0.88%

Ecuador

0

1

2

3

0.66%

Honduras

1

2

0

3

0.66%

Cuba

1

1

0

2

0.44%

England

1

0

1

2

0.44%

Laos

0

1

1

2

0.44%

Peru

2

0

0

2

0.44%

Philippines

0

0

2

2

0.44%

Sierra Leone

2

0

0

2

0.44%

Ukraine

0

1

1

2

0.44%

Wales

0

2

0

2

0.44%

Other Countries

9

10

5

24

5.27%

Total

183

172

100

455

100.00%

Source: Research and Evaluation DOC Report ICE inmates list 01 May 19.

David Olen Cross of Salem, Oregon is crime researcher who writes on immigration issues and foreign national crime. The preceding report is a service to federal, state, county and city elected and non elected governmental officials to help them assess the impact of foreign national crime in the United States of America. He can be reached at docfnc@yahoo.com. His past crime reports can be found at http://docfnc.wordpress.com/.


  Read more about Oregon Department of Corrections: Foreign National Sex Crime Report May 2019

New High in U.S. Say Immigration Most Important Problem

Story Highlights

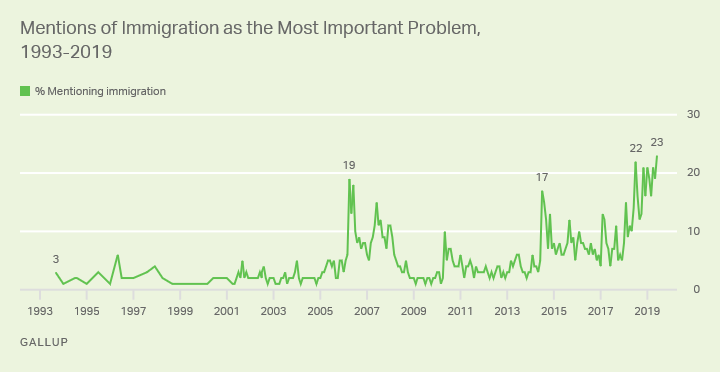
  • 23% mention immigration as most important problem, highest in Gallup trends
  • The government is the most commonly mentioned problem, at 26%
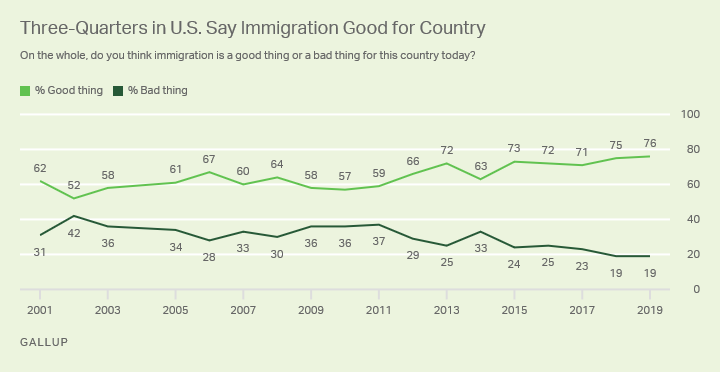
  • Most Americans still say immigration a good thing for the U.S.

WASHINGTON, D.C. -- Americans' concern with immigration continues to be heightened, as 23% name it the most important problem facing the country. This is by one percentage point the highest Gallup has ever measured for the issue since it first began recording mentions of immigration in 1993.

Line graph. Americans’ mentions of immigration as the country’s most important problem reached a high of 23% in June.

The June 3-16 poll was conducted as the U.S. continues to grapple with how to handle a surge of Central American immigrants at the U.S.-Mexican border. Gallup has previously found spikes in mentions of immigration as the most important U.S. problem at other times when the immigration debate intensified, including:

  • 22% in July 2018 amid controversy over a U.S. policy to separate children and parents who were trying to enter the U.S. illegally
  • 17% in July 2014, when a wave of young immigrants from Central American countries crossed the U.S. border illegally
  • 19% in April 2006 as the Senate worked toward passage of a comprehensive immigration reform bill it later passed but ultimately was not considered by the House of Representatives

Mentions of immigration have been higher on average in 2019 than in any prior year. The 20% average to date compares with 14% in 2018, and no more than 10% in any other year.

Yet immigration has typically finished behind the government as the nation's top problem over the past three years, and did so again this month, when 26% of Americans named the government. Government has finished ahead of immigration in all but two months since February 2017 (July and November 2018). This included a record 35% naming the government in February.

Concern about the government is broadly distributed across the three major partisan groups, with 32% of Democrats and 23% of both Republicans and independents currently identifying it as the most important problem. In contrast, immigration mentions are far more common among Republicans (42%) than Democrats (7%). Twenty-one percent of independents name it.

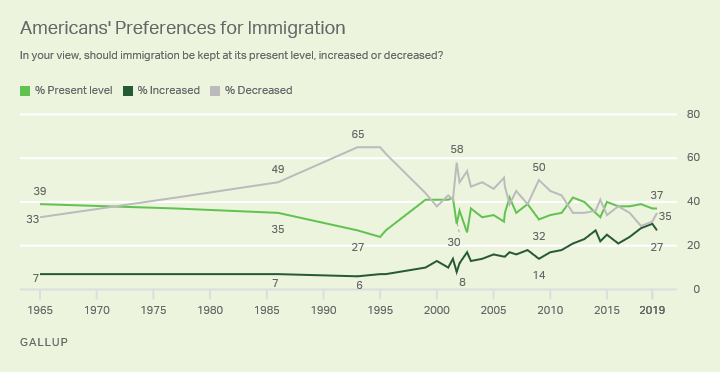
One in Three Want Immigration Levels Decreased

Asked their preferences for U.S. immigration levels, 37% of Americans say it should be kept at its present level, while more say it should be decreased (35%) than increased (27%). The percentage wanting immigration reduced is higher than the average 30% holding this view in Gallup's two prior surveys, in January 2019 and July 2018. However, in the past, many more Americans have called for a reduction than do so now, including 41% in June 2014, 58% in October 2001 (after 9/11), and a record 65% in the mid-1990s during a surge of illegal immigration in California.

In recent years, there has been an uptick in the percentage who want immigration to the U.S. increased. Before 2012, the percentage never reached 20%, but it has been above that mark since, including a record 30% in January.

Line graph. Among Americans, 37% want immigration kept at current levels, 35% would prefer it decreased and 27% increased.

As their differences in perceptions of immigration as the most important problem would suggest, partisans have divergent views on U.S. immigration levels. A slim majority of Republicans, 54%, want them decreased, while 31% want them kept the same and 13% increased. Democrats are about equally likely to prefer increased immigration (43%) as to want current levels maintained (42%); just 13% want immigration cut. Independents' views essentially match those of all U.S. adults.

Public Mixed in Assessment of Immigration's Effects

Even as they acknowledge immigration as one of the nation's most pressing problems, Americans still view immigration positively in general, with 76% describing it as a good thing for the country today and 19% as a bad thing. Since Gallup first asked this question in 2001, no fewer than 52% have affirmed immigration's value, with the current year's figure the highest to date by one point.

Line graph. Three-quarters, 76%, of Americans say immigration is good for the country, 19% say it is bad for the U.S.

Notably, two-thirds of Americans who identify immigration as the most important problem still believe it is a good thing for the country.

Democrats (87%) are much more likely than Republicans (62%) to say immigration is a good thing, with 78% of independents holding that view.

Americans' assessments of the effect of immigration on six aspects of U.S. society are mixed. In two areas -- the economy and food, music, and the arts -- more believe immigration has made the situation better than made it worse. The public is divided as to immigration's effects on social and moral values and job opportunities for their family, but more evaluate immigration's effect on crime and taxes negatively than positively.

Americans' Views of Immigration's Impact Mixed
For each of the following areas, please say whether immigrants to the United States are making the situation in the country better or worse, or not having much effect. How about -- [RANDOM ORDER]?


Better

Worse

No effect

Net (% Better - % Worse)


%

%

%

pct. pts.

Food, music and the arts

The economy in general

Social and moral values

Job opportunities for you and your family

Taxes

The crime situation

Gallup, June 3-16, 2019
57 10 32 +47
43 31 25 +12
31 28 39 +3
19 25 56 -6
20 42 37 -22
7 42 50 -35
 

Americans' opinions on the impact immigration has on these aspects of society have shifted in a more positive direction over the past two decades. Specifically, the public is much more positive today about immigration's effect on the economy and job opportunities than they were in 2001, when Gallup first asked the question. While still negative overall today, Americans are less negative about immigration's effect on taxes and the crime situation than they were 18 years ago.

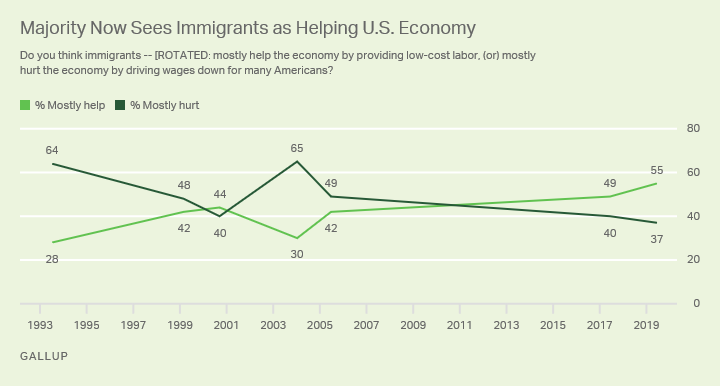
Probing further on immigration's impact on the economy, the poll asked Americans whether immigrants "mostly help the economy by providing low-cost labor" or "mostly hurt the economy by driving down wages for many Americans." For the first time, a majority of Americans say immigrants mostly help the economy, with 55% holding this view, compared with 37% who see immigrants as harming the economy. In 1993 and 2004 surveys, large majorities of Americans saw immigrants as detrimental to the economy.

Line graph. More than half, 55%, of Americans see immigrants as mostly helping the U.S. economy; 37% see them as hurting it.

Republicans disagree with Democrats and independents on the effect of immigration on the economy. Whereas 60% of Republicans see immigration as hurting the economy, 72% of Democrats and 58% of independents believe it helps.

Implications

At a time when Americans are more likely to name immigration as the most important problem facing the country than any in recent memory, they hold mixed views about it. They still see immigration as a good thing for the country, and more believe it benefits than harms the economy. About one-third want to see immigration levels reduced, but that is a lower proportion than in past surveys, including times when fewer Americans viewed immigration as a pressing U.S. problem.

The issue continues to challenge U.S. lawmakers, as Congress and Presidents George W. Bush, Barack Obama and Donald Trump have been unable to enact meaningful legislation to stem the flow of illegal immigrants to the country and develop a plan for immigrants living in the U.S. illegally. As such, the issue promises to remain a major one in the coming presidential election.

View complete question responses and trends.

Learn more about how the Gallup Poll Social Series works.

  Read more about New High in U.S. Say Immigration Most Important Problem

Oregon Department of Corrections: Foreign National Homicide Report May 2019

Information obtained from the Oregon Department of Corrections (DOC) indicated on May 1, 2019 that 131 of the 910 foreign nationals (criminal aliens) in the state’s prison system were incarcerated for homicidal crimes (various degrees of murder and manslaughter) — 14.40 percent of the criminal alien prison population (Note: The number of criminal aliens incarcerated for homicidal crimes in DOC prisons does not necessarily equal the number of Oregon residents killed by alien homicidal violence).

Using DOC U.S. Immigration and Customs Enforcement (ICE) immigration detainer numbers, the following table reveals the total number criminal alien inmates along with the number and percentage of those alien inmates incarcerated on May 1st in the state’s prisons for homicidal crimes.
 

OREGON DEPARTMENT OF CORRECTIONS

Month/Day/Year

DOC Total Number Inmates W/ICE Detainers

DOC Number of Inmates W/ICE Detainers for Homicidal Crimes

DOC Percent of Inmates W/ICE Detainers for Homicidal Crimes

May 1, 2019

910

131

14.40%

Source: Research and Evaluation DOC Report ICE inmates list 01 May 19.

Criminal aliens incarcerated in DOC prisons committed at least one crime of homicidal violence in 22 of 36 Oregon counties — 66.11 percent of the counties in the state.

Seven Oregon counties, Multnomah (34 alien inmates convicted of homicidal crimes), Marion (22 alien inmates convicted of homicidal crimes), Washington (21 alien inmates convicted of homicidal crimes), Umatilla (9 alien inmates convicted of homicidal crimes), Clackamas (7 alien inmates convicted of homicidal crimes), Jackson (6 alien inmates convicted of homicidal crimes) and Lane (6 alien inmates convicted of homicidal crimes) had 105 of 131 criminal alien inmates incarcerated in DOC prisons for homicidal violence — 80.15 percent of the alien inmates in the state’s prisons for homicidal crimes.

Using DOC ICE immigration detainer numbers, the following table reveals the number and percentage of criminal alien inmates incarcerated on May 1st that were sent to prison from the state’s 36 counties for homicidal crimes.
 

OREGON DEPARTMENT OF CORRECTIONS

County

DOC Number of Inmates W/ ICE Detainers by County Incarcerated for Homicidal Crimes

DOC Percent of Inmates W/ ICE Detainers by County Incarcerated for Homicidal Crimes

Multnomah

34

25.95%

Marion

22

16.79%

Washington

21

16.03%

Umatilla

9

6.87%

Clackamas

7

5.34%

Jackson

6

4.58%

Lane

6

4.58%

Klamath

3

2.29%

Linn

3

2.29%

Yamhill

3

2.29%

Benton

2

1.53%

Josephine

2

1.53%

Lincoln

2

1.53%

Polk

2

1.53%

Clatsop

1

0.76%

Deschutes

1

0.76%

Douglas

1

0.76%

Gilliam

1

0.76%

Hood River

1

0.76%

Jefferson

1

0.76%

Malheur

1

0.76%

OOS (Not a County)

1

0.76%

Tillamook

1

0.76%

Baker

0

0.00%

Columbia

0

0.00%

Coos

0

0.00%

Crook

0

0.00%

Curry

0

0.00%

Grant

0

0.00%

Harney

0

0.00%

Lake

0

0.00%

Morrow

0

0.00%

Sherman

0

0.00%

Union

0

0.00%

Wallowa

0

0.00%

Wasco

0

0.00%

Wheeler

0

0.00%

Total

131

100.00%

Source: Research and Evaluation DOC Report ICE inmates list 01 May 19.

Criminal aliens from 21 different countries have committed homicidal violence against Oregon residents.

Foreign nationals who declared their country or origin as being Mexico were 100 of 131 criminal aliens convicted of homicidal crimes incarcerated in the DOC prison system — 76.34 percent of the alien inmates in the state’s prisons for homicidal crimes.

Using DOC ICE immigration detainer numbers, the following table reveals the self-declared countries of origin of the 131 criminal alien inmates by number and percentage incarcerated on May 1st in the state’s prisons for homicidal crimes.
 

OREGON DEPARTMENT OF CORRECTIONS

Country

DOC Number of Inmates W/ ICE Detainers by Country Incarcerated for Homicidal Crimes

DOC Percent of Inmates W/ ICE Detainers by Country Incarcerated for Homicidal Crimes

Mexico

100

76.34%

Cuba

4

3.05%

Canada

3

2.29%

Vietnam

3

2.29%

Cambodia

2

1.53%

El Salvador

2

1.53%

Laos

2

1.53%

South Korea

2

1.53%

Colombia

1

0.76%

Costa Rica

1

0.76%

Guatemala

1

0.76%

Honduras

1

0.76%

Japan

1

0.76%

Mariana Islands

1

0.76%

Marshall Islands

1

0.76%

Nicaragua

1

0.76%

Nigeria

1

0.76%

Peru

1

0.76%

Philippines

1

0.76%

South Africa

1

0.76%

Turkey

1

0.76%

Total

131

100.00%

Source: Research and Evaluation DOC Report ICE inmates list 01 May 19.

David Olen Cross of Salem, Oregon is a crime researcher who writes on immigration issues and foreign national crime. The preceding report is a service to federal, state, county and city elected and non elected governmental officials to help them assess the impact of foreign national crime in the United States of America. He can be reached at docfnc@yahoo.com. His past crime reports can be found at http://docfnc.wordpress.com/.


  Read more about Oregon Department of Corrections: Foreign National Homicide Report May 2019

Immigration Agency Says It Plans Deportation Operation Aimed at Undocumented Families

WASHINGTON - The acting directtor of the Immigration and Customs Enforcement agency said on Wednesday that he would follow through with plans to send agents into communities to round up and deport undocumented families, in the Trump administration’s latest attempt to deter large-scale migration of Central Americans to the southwest border.

The acting director, Mark Morgan, who has signaled for weeks that there would be a heightened focus on deporting families, told reporters that agents would target more than 2,000 immigrant family members who already have deportation orders.

“Do not come,” Mr. Morgan said in describing the message he wants to send to people from Honduras, Guatemala and El Salvador who think they will be able to remain in the United States once they get across the border. “Do not risk it. Do not pay the cartels an exorbitant amount of money because once you receive due process and get a final order, you will be removed.”

Mr. Morgan’s comments came after President Trump tweeted on Monday that the immigration agency would deport millions of people next week....

The agency has, however, taken steps in recent days to prepare for mass arrests...

“I don’t want to send ICE agents to their workplace,” Mr. Morgan said. “I don’t want to send ICE agents to their home. I don’t want to send ICE agents to try and track them down and apprehend them in their communities and town. But we’ve applied due process. We’ve tried to work with them.”

The targeted operation is expected to occur over the course of multiple days and is expected in the coming weeks...agents would be rounding up undocumented immigrant families if they failed to report to an immigration agency field office for deportation.

Immigration officials have said the increase in migration has crowded facilities and pushed resources beyond capacity, prompting the release of migrants into the general population.

More than 144,200 migrants were taken into custody at the border last month, the highest monthly total in 13 years. Many of them seek asylum but only a minority of them ultimately win their cases in immigration courts. The families are usually released...

Among the 2,000 undocumented immigrants being targeted now are those whose court cases were expedited, having typically missed a court date and been ordered deported from the country in absentia. They were sent letters in February demanding they report to an immigrations and customs office to leave the country, Mr. Morgan said.

While Mr. Morgan said the agency would still target violent criminals for removal, “priorities do not mean other categories are exempt.”

“And again,” he added, “I think family units are a good example of that.”

Homeland Security Department officials have changed their minds multiple times in recent days over when to start the operations...

“It’s people, and people are complicated,” said Ronald D. Vitiello, the former acting director of the immigration and customs agency who had his nomination pulled by Mr. Trump after he warned of the bad impressions the raids would leave. “Some of them might be sick and need to be treated for illness. Some might be separated in a way that the child might be at school and the parents at home.”

More than 207,000 migrants have been released since December of last year, Mr. Morgan said. Many of them, he said, have taken advantage of laws that prevent the extended confinement of children, which enabled families to be quickly released after being apprehended.

“It’s clear if you grab a child that’s your passport in the United States,” Mr. Morgan said.

But the mass arrests come with logistical challenges.

There is limited space in the family detention facilities where migrants would be held while the government tries to secure their travel documents, which are required to deport them. But keeping families there could result in violations of the agreement, known as the Flores settlement, that established standards for the detention of children and limits it to 20 days.

While immigration authorities could theoretically deport all those who have evaded removal orders, they will not be able to remove them all immediately. They are likely to contend with motions to reopen cases of those migrants who missed their hearing along with requests for a stay of removal.

Among the reasons immigrants could cite to justify reopening their case would be their failure to receive proper notice of the removal hearing...

The result, immigration lawyers predicted, is likely to be a flood of challenges clogging the already overburdened court system.

“Lawyers are going to come running,” said Kelli Stump, an immigration lawyer in Oklahoma City who specializes in removal defense.

A version of this article appears in print on June 19, 2019, on Page A16 of the New York edition with the headline: About 2,000 Family Members Are Focus of Deportation Plan.

  Read more about Immigration Agency Says It Plans Deportation Operation Aimed at Undocumented Families

Oregon Department of Corrections: Mexican National Crime Report May 2019

Information obtained from the Oregon Department of Corrections (DOC) indicated on May 1, 2019 that 728 of the 910 foreign nationals (criminal aliens) in the state’s prison system were Mexican nationals — 80.00 percent of the criminal alien prison population (Note: The number of Mexican nationals incarcerated in DOC prisons does not necessarily equal the number of Oregon residents victimized by this specific group of criminal aliens).

Using DOC U.S. Immigration and Customs Enforcement (ICE) immigration detainer numbers, the following table reveals the total number criminal alien inmates along with the number and percentage of those alien inmates incarcerated on May 1st in the state’s prisons who declared themselves as being Mexican nationals.
 

OREGON DEPARTMENT OF CORRECTIONS

Month/Day/Year

DOC Total Inmates W/ICE Detainers

DOC Number of Mexican National Inmates W/ICE Detainers

DOC Percent of Mexican National Inmates W/ICE Detainers

May 1, 2019

910

728

80.00%

Source: Research and Evaluation DOC Report ICE inmates list 01 May 19.

Mexican (MEX) national criminals were sent to DOC prisons from 29 of 36 Oregon counties — 80.56 percent of the counties in the state.

Seven Oregon counties, Marion (185 MEX inmates), Washington (149 MEX inmates), Multnomah (115 MEX inmates), Clackamas (61 MEX inmates), Lane (33 MEX inmates), Jackson (30 MEX inmates) and Umatilla (26 MEX inmates) had 599 of the 728 Mexican national inmates incarcerated in DOC prisons — 82.28 percent of the MEX inmates.

Using DOC ICE detainer numbers, the following table reveals the number and percentage of Mexican national inmates incarcerated on May 1st that were sent  to prison from the state’s 36 counties.
 

OREGON DEPARTMENT OF CORRECTIONS

County

DOC Number of Mexican National Inmates by County W/ ICE Detainers

DOC Percent of Mexican National Inmates by County W/ICE Detainers

Marion

185

25.41%

Washington

149

20.47%

Multnomah

115

15.80%

Clackamas

61

8.38%

Lane

33

4.53%

Jackson

30

4.12%

Umatilla

26

3.57%

Yamhill

20

2.75%

Linn

15

2.06%

Polk

12

1.65%

Benton

10

1.37%

Klamath

10

1.37%

Deschutes

9

1.24%

Malheur

9

1.24%

Jefferson

7

0.96%

Tillamook

5

0.69%

Wasco

5

0.69%

Coos

4

0.55%

Hood River

4

0.55%

Lincoln

4

0.55%

Clatsop

3

0.41%

Douglas

3

0.41%

Josephine

3

0.41%

Baker

1

0.14%

Crook

1

0.14%

Gilliam

1

0.14%

Lake

1

0.14%

Morrow

1

0.14%

Union

1

0.14%

Columbia

0

0.00%

Curry

0

0.00%

Grant

0

0.00%

Harney

0

0.00%

Sherman

0

0.00%

Wallowa

0

0.00%

Wheeler

0

0.00%

Total

728

100.00%

Source: Research and Evaluation DOC Report ICE inmates list 01 May 19.

Here are the ways Oregon residents were victimized by the 728 Mexican national criminals.

Significant numbers, there were 380 of the 728 criminal alien inmates from Mexico incarcerated in DOC prisons for three types of sex crimes — sex abuse, rape and sodomy — 52.20 percent of the Mexican national inmates in the state’s prisons.

Using DOC ICE detainer numbers, the following table reveals the number and percentage of Mexican national inmates incarcerated on May 1st by type of crime.
 

OREGON DEPARTMENT OF CORRECTIONS

Crime

DOC Number of Mexican National Inmates by Type of Crime W/ ICE Detainers

DOC Percent of Mexican National Inmates by Type of Crime W/ICE Detainers

Sex Abuse

161

22.12%

Rape

140

19.23%

Homicide

100

13.74%

Sodomy

79

10.85%

Drugs

75

10.30%

Assault

63

8.65%

Robbery

29

3.98%

Kidnapping

17

2.34%

Burglary

12

1.65%

Theft

4

0.55%

Driving Offense

3

0.41%

Vehicle Theft

2

0.27%

Arson

0

0.00%

Escape

0

0.00%

Forgery

0

0.00%

Other / Comb. Crimes

43

5.91%

Total

728

100.00%

Source: Research and Evaluation DOC Report ICE inmates list 01 May 19.

When compared to the overall DOC criminal alien prison population, Mexican nationals were 100 of the 131 criminal aliens convicted of homicidal crimes (various degrees of murder and manslaughter) incarcerated in the state’s prison system — 76.34 percent of all alien inmates serving time for homicidal crimes.

Using the DOC ICE detainer numbers from May 1st, the following table reveals the total number of criminal alien inmates incarcerated by type of crime, the number of Mexican national inmates incarcerated by type of crime and the percentage of Mexican national inmates incarcerated by type of crime.
 

OREGON DEPARTMENT OF CORRECTIONS

Crime

DOC Total Number of Inmates by Type of Crime W/ICE Detainers

DOC Number of Mexican National Inmates by Type of Crime W/ ICE Detainers

DOC Percent of Mexican National Inmates by Type of Crime W/ICE Detainers

Sex Abuse

183

161

87.98%

Rape

172

140

81.40%

Homicide

131

100

76.34%

Sodomy

100

79

79.00%

Assault

85

63

74.12%

Drugs

81

75

92.59%

Robbery

45

29

64.44%

Kidnapping

26

17

65.38%

Burglary

18

12

66.67%

Theft

16

4

25.00%

Driving Offense

4

3

75.00%

Vehicle Theft

2

2

100.00%

Arson

0

0

0.00%

Escape

0

0

0.00%

Forgery

0

0

0.00%

Other / Comb. Crimes

47

43

91.49%

Total

910

728


Source: Research and Evaluation DOC Report ICE inmates list 01 May 19.

Beyond the DOC Mexican national incarceration numbers and incarceration percentages, per county and per type of crime, criminal aliens from Mexico place a substantial economic burden on Oregonians.

An individual inmate incarcerated in the DOC prison system costs the state approximately ($108.26) per day.

The DOC’s incarceration cost for 728 Mexican national inmates is approximately ($78,813.28) per day, ($551,692.96) per week, and ($28,766,847.20) per year.

None of preceding cost estimates for the DOC to incarcerate the 728 Mexican national inmates includes the dollar amount for legal services (indigent defense), language interpreters, court costs, or victim assistance.

Bibliography:

Oregon Department of Corrections Population Profile (unpublished MS Excel workbook) titled Incarcerated Criminal Aliens Report dated May 1, 2019.

Oregon Department of Corrections Issue Brief Quick Facts, March 2019:
https://www.oregon.gov/doc/Documents/agency-quick-facts.pdf

David Olen Cross of Salem, Oregon is crime researcher who writes on immigration issues and foreign national crime. The preceding report is a service to federal, state, county and city elected and non elected governmental officials to help them assess the impact of foreign national crime in the United States of America. He can be reached at docfnc@yahoo.com. His past crime reports can be found at http://docfnc.wordpress.com/. Read more about Oregon Department of Corrections: Mexican National Crime Report May 2019

NO on HB 2015! Call Oregon Senators this week!

Alert date: 
June 19, 2019
Alert body: 

HB 2015 (drivers licenses for illegal aliens) is on the edge of the cliff and we need your help to stop it! Contact your Senator and, if you are able, contact every other Senator, too.
Remind them that Oregon voters already said NO with a 66% NO vote. New Zogby polling shows that 63% of Oregonians still OPPOSE drivers licenses for illegal aliens.
Call or email today! Time is running out. 
 

Oregon Department of Corrections: Criminal Alien Report for the Americas May 2019

Information obtained from the Oregon Department of Corrections (DOC) indicated on May 1, 2019 that 811 of the 910 foreign nationals (criminal aliens) in the state’s prison system self-declared their countries of origin as being located in the Americas — North, Central and South America and the West Indies — 89.12 percent of the criminal alien prison population (Note: The United States of America (USA) and USA territories are excluded from this report.):

- North America (Mexico an Canada) had 733 criminal aliens — 90.38 percent of the DOC alien prisoners from the Americas;

- Central America (Guatemala, El Salvador, Honduras, Costa Rica, Nicaragua, Belize and Panama) had 51 criminal aliens — 6.29 percent of the DOC alien prisoners from the Americas;

- South America (Ecuador, Peru, Argentina, Brazil and Colombia) had nine criminal aliens — 1.11 percent of the DOC alien prisoners from the Americas;

- The West Indies (Cuba, Jamaica and Turks) had 18 criminal aliens — 2.22 percent of the DOC alien prisoners from the Americas.

Criminal aliens from 17 countries located in the Americas were incarcerated in the DOC prison system.

Mexican nationals were 728 of 811 criminal aliens from the Americas incarcerated in the DOC prison system — 89.77 percent of the alien inmates from the Americas in the state’s prisons.

Some background information, all 811 criminal aliens incarcerated in the DOC prison system from the Americas were identified by U.S. Immigration and Customs Enforcement (ICE) and have ICE detainers placed on them.

Using DOC ICE detainer numbers, the following table reveals the self-declared countries of origin of the 811 criminal alien inmates from the Americas by number and percentage incarcerated on May 1st in the state’s prisons.
 

OREGON DEPARTMENT OF CORRECTIONS

Country

DOC Total Number of Inmates W/ICE Detainers by Self-Declared Country of Origin from the Americas

DOC Percent Inmates W/ICE Detainers by Self-Declared Country of Origin from the Americas

Mexico

728

89.77%

Guatemala

21

2.59%

Cuba

16

1.97%

El Salvador

13

1.60%

Honduras

11

1.36%

Canada

5

0.62%

Ecuador

3

0.37%

Peru

3

0.37%

Costa Rica

2

0.25%

Nicaragua

2

0.25%

Argentina

1

0.12%

Belize

1

0.12%

Brazil

1

0.12%

Colombia

1

0.12%

Jamaica

1

0.12%

Panama

1

0.12%

Turks

1

0.12%

Total

811

100.00%

Source: Research and Evaluation DOC Report ICE inmates list 01 May 19.

Here are the ways Oregon residents were victimized by the 811 criminal aliens from the Americas.

Significant numbers, there were 416 of the 811 criminal alien inmates from the Americas incarcerated in DOC prisons for three types of sex crimes — sex abuse, rape and sodomy — 51.29 percent of the alien inmates from the Americas in the state’s prisons.

Using DOC ICE detainer numbers, the following table reveals the number and percentage of criminal alien inmates from the Americas incarcerated on May 1st by type of crime.
 

OREGON DEPARTMENT OF CORRECTIONS

Crime

Total Number of Inmates W/ ICE Detainers by Type of Crime from the Americas

DOC Percent of  Inmates W/ICE Detainers by Type of Crime from the Americas

Sex Abuse

173

21.33%

Rape

154

18.99%

Homicide

115

14.18%

Sodomy

89

10.97%

Drugs

77

9.49%

Assault

75

9.25%

Robbery

33

4.07%

Kidnapping

22

2.71%

Burglary

12

1.48%

Theft

11

1.36%

Driving Offense

4

0.49%

Vehicle Theft

2

0.25%

Arson

0

0.00%

Escape

0

0.00%

Forgery

0

0.00%

Other / Combination Crimes

44

5.43%

Total

811

100.00%

Source: Research and Evaluation DOC Report ICE inmates list 01 May 19.

Criminal aliens from the Americas incarcerated in DOC prisons committed at least one crime in 29 of 36 Oregon counties — 80.56 percent of the counties in the state.

Using DOC ICE detainer numbers, the following table reveals the number and percentage of criminal alien inmates from the Americas incarcerated on May 1st that weresent to prison from the state’s 36 counties.
 

OREGON DEPARTMENT OF CORRECTIONS

County

DOC Total Number of  Inmates W/ ICE Detainers by County from the Americas

DOC Percent of Inmates W/ICE Detainers by County from the Americas

Marion

195

24.04%

Washington

174

21.45%

Multnomah

137

16.89%

Clackamas

67

8.26%

Lane

37

4.56%

Jackson

32

3.95%

Umatilla

28

3.45%

Yamhill

21

2.59%

Linn

17

2.10%

Polk

13

1.60%

Benton

11

1.36%

Deschutes

11

1.36%

Klamath

10

1.23%

Malheur

9

1.11%

Jefferson

8

0.99%

Josephine

5

0.62%

Lincoln

5

0.62%

Tillamook

5

0.62%

Wasco

5

0.62%

Coos

4

0.49%

Hood River

4

0.49%

Clatsop

3

0.37%

Douglas

3

0.37%

Morrow

2

0.25%

Baker

1

0.12%

Crook

1

0.12%

Gilliam

1

0.12%

Lake

1

0.12%

Union

1

0.12%

Columbia

0

0.00%

Curry

0

0.00%

Grant

0

0.00%

Harney

0

0.00%

Sherman

0

0.00%

Wallowa

0

0.00%

Wheeler

0

0.00%

Total

811

100.00%

Source: Research and Evaluation DOC Report ICE inmates list 01 May 19.

Beyond the DOC criminal alien incarceration numbers and percentages by countries of origin, by crime types or by the state’s counties, criminal aliens from the Americas pose high economic cost on Oregon tax payers.

An individual inmate incarcerated in the DOC prison system costs the state approximately ($108.26) per day.

The DOC’s incarceration cost for its 811 criminal alien prison population from the Americas is approximately ($87,798.86) per day, ($614,592.02) per week, and ($32,046,583.90) per year.

None of preceding cost estimates for the DOC to incarcerate the 811 criminal aliens from the Americas includes the dollar amount for legal services (indigent defense), language interpreters, court costs, or victim assistance.

Bibliography:

Oregon Department of Corrections Population Profile (unpublished MS Excel workbook) titled Incarcerated Criminal Aliens Report dated May 1, 2019.

Oregon Department of Corrections Issue Brief Quick Facts, March 2019:
https://www.oregon.gov/doc/Documents/agency-quick-facts.pdf

David Olen Cross of Salem, Oregon is crime researcher who writes on immigration issues and foreign national crime. The preceding report is a service to federal, state, county and city elected and non elected governmental officials to help them assess the impact of foreign national crime in the United States of America. He can be reached at docfnc@yahoo.com. His past crime reports can be found at http://docfnc.wordpress.com/. Read more about Oregon Department of Corrections: Criminal Alien Report for the Americas May 2019

Pages

Subscribe to RSS - illegal aliens