ICE

Congressman Ron Wyden holding Towhall meetings this weekend

Alert date: 
February 2, 2018
Alert body: 

Have something to say to Congressman Ron Wyden? He would like to see you at one of his upcoming Townhall Meetings this weekend.

Saturday, Feb. 3 - starts at 11:30 am
Astoria High School Auditorium
1001 W Marine Dr., Astoria, OR 97103
 
and
 
Saturday, Feb. 3, starts at 4 pm
Port of Tillamook Bay, Officers Mess Hall
6825 Officer's Row, Tillamook, OR 97141
 
-------------
 
Sunday, Feb. 4 - starts Noon
Century High School Gymnasium
2000 SE Century Blvd., Hillsboro, OR 97123
 
If you attend, please email van@numbersusa.com a brief description of your interaction and the immigration-related discussion. Or, call OFIR at 503.435.0141 and tell us about it.
 
Talking Points for your consideration:
 
You were responsible for shutting down the federal government, not Republicans. And for what? To amnesty illegal aliens. You're playing a destructive political game. You knew negotiations were ongoing. Do not vote for another shutdown.
 
You are pushing a legalization for so-called Dreamers but don't care what caused these young people to be in the country illegally in the first place. Their parents brought them while seeking to work here illegally. We'll be in this situation again unless we make it hard for employers to hire unlawful workers. That's why I want you to support mandatory E-Verify workplace eligibility checks for all employers. Don't subject another generation of young people to the same situation.
 
Our immigration system should help American workers get a decent pay raise and have a higher standard of living. That's why Sen. Tom Cotton introduced the RAISE Act, which would cut legal immigration from about one million per year to 500,000. I strongly support the bill because it will reduce job competition, including for the 50 million working-age Americans not in the workforce. Please co-sponsor the RAISE Act. Stand with American workers, not anti-American business owners who want more job competition to reduce wages.
 
The Visa Lottery must be terminated because it threatens our national security, as evidenced by the October 31 New York City terrorist attack by lottery winner Sayfullo Saipov. The program is fraud-ridden, because it has low application standards, and draws from nations that are state sponsors of terror or are known to harbor terrorist organizations. This dangerous combination made the program the subject of numerous congressional oversight hearings and a target for repeal. Please support a repeal of the Visa Lottery.
 
A biometric entry/exit system was a key recommendation of the 9/11 Commission after it learned that several of the hijackers had overstayed their visas. But despite Congressional approval and funding, the last two administrations failed to implement this essential system for tracking and removing visa over-stayers. There is no excuse for further delays in these dangerous times, so I want you to help get this done.


U.S. Federal Bureau of Prisons: Criminal Alien Report December 2017

The United States having a significant foreign national population residing within the nations boundaries, be they legally or illegally present in the country, unfortunately includes those who commit crimes.

The extent and impact of foreign national crime on the U.S. citizens and residents of this country is explicitly revealed by a simple search on the U.S. Federal Bureau of Prisons (BOP) inmates statistics website under the heading of inmate citizenship.

Here are the countries of origin, moreover, the number and percentage of those countries citizens recently incarcerated in the U.S. BOP prison system (The most recent BOP crime numbers available were from December 30, 2017.).

Inmate Citizenship:

- México 23,805 inmates, 13.0 percent;
- Colombia 1,683 inmates, 0.9 percent;
- Dominican Republic 1,443 inmates, 0.8 percent;
- Cuba 1,196 inmates, 0.7 percent;
- Other / unknown countries 9,080 inmates, 4.9 percent;
- United States 145,851 inmates, 79.7 percent;

Total Inmates: 183,058 inmates.

To clarify the meaning of these preceding criminal alien inmate numbers and percentages, I will translate them into words:

Combining December 30th BOP criminal alien inmate numbers, there were 37,207 criminal aliens in the BOP prison system. Alien inmates were 20.3 percent of the federal prison population; more than two in every ten inmates were criminal aliens.

With 23,805 Mexican nationals being incarcerated in the BOP prison system, at 64.0 percent, they were the vast majority of criminal aliens in federal prisons.

The U.S. Federal Bureau of Prisons breaks down the federal prison population into 13 types of offenses. One of the top five offenses, the reason inmates are serving time in federal prisons is for immigration crimes. There were 12,246 inmates in the BOP prison system incarcerated for immigration crimes; they were 7.1 percent of the federal prison population.

An urgent wakeup call to all American citizens, eventually the majority of these criminal aliens from México, Colombia, Dominican Republic, Cuba and other countries will be released from the U.S. Federal Bureau of Prisons after completing their prison terms.

The country of Mexico, America’s neighbor to the south, is both historically and literally a land bridge of many frequently unsecured trails, roads, highways and railways used by persons trying and far too often successfully illegally entering our country.

United States citizens should, if they haven’t already, contact their members of the U.S. Congress (two Senators and one Representative) and tell them to support President Donald J. Trump’s commitment to build a wall (fences and technology) along the U.S. border with Mexico to stop the threat of tens of thousands of criminal aliens, once they are released from the federal prison system and deported by U.S. Immigration and Customs Enforcement to their countries of origin, ability to illegally return to this nation and harm its citizens and residents.

David Olen Cross of Salem, Oregon is an independent crime researcher who writes on immigration issues and foreign national crime. He is a weekly guest on the Lars Larson northwest radio show. He can be reached at docfnc@yahoo.com or at http://docfnc.wordpress.com/ Read more about U.S. Federal Bureau of Prisons: Criminal Alien Report December 2017

Is Oregon's Congressional Delegation a shameful representation of America's values?

Illegal Aliens at SOTU Reveal Amnesty, Not American Interests, is Priority for Many on One Side of the Aisle

by Federation for American Immigration Reform (FAIR) Executive Director Bob Dane

(January 30, 2018, Washington, D.C.) — Dozens of illegal aliens will attend the State of the Union address, invited as distinguished guests by Democrat lawmakers.

“This annual stunt is deeply offensive to Americans who know that the rule of law is the bedrock of our democracy. The United States Capitol is the revered building where those laws are made by the world’s greatest deliberative body; it is not an unruly theatre for flouting lawlessness. By granting VIP access to dozens of illegal aliens who consciously and proudly violate our laws, the Democrat members of Congress who invited them have clearly revealed their contempt for the rule of law as well.

“Those members have also revealed their real agenda; massive amnesty, unlimited immigration and disregard for any reforms that serve the American public’s interest. The message that will be sent by tonight’s presence of so-called ‘Dreamers’ is crystal clear and one-sided: violating our immigration laws is an inconsequential act and the public just needs to get used to it. We’re here, we’re unapologetic, we’re not going anywhere, we’re going to sit and stand anywhere we want – including the United States Capitol – and we demand to be rewarded with citizenship.  

“These tactics only serve to alienate many Americans and set back the debate. Americans have long needed – and have been promised – secure borders, robust interior enforcement, and a reduction in legal immigration levels while moving to a modern, merit-based system. None of it has happened, and tonight’s antics are an infuriating reminder of that, while also confirming who is responsible for the immigration reform stalemate.

“’Dreamers’ should consider whether they are just being used as political props by some Democrats who continue to oppose any and all reasonable immigration proposals. ‘Dreamers’ are certainly not advancing their cause with these defiant tactics that offend many Americans who might otherwise be interested in an earnest bipartisan solution, but only if it offers them what they want too.”
  Read more about Is Oregon's Congressional Delegation a shameful representation of America's values?

Oregon Department of Corrections: Foreign National Drug Crime Report December 2017

Information obtained from the Oregon Department of Corrections (DOC) indicated that on December 1, 2017 that 97 of the 973 foreign nationals (criminal aliens) in the state’s prison system were incarcerated for drug crimes, 9.97 percent of the criminal alien prison population.

Using DOC U.S. Immigration and Customs Enforcement (ICE) immigration detainer numbers, the following table reveals the total number criminal alien inmates along with the number and percentage of those alien inmates incarcerated on December 1st in the state’s prisons for drug crimes.
 

OREGON DEPARTMENT OF CORRECTIONS

Month/Day/Year

DOC Total Inmates W/ICE Detainers

DOC Number of Inmates W/ICE Detainers for Drug Crimes

DOC Percent of Inmates W/ICE Detainers for Drug Crimes

December 1, 2017

973

97

9.97%

Source: Research and Evaluation DOC Report ICE inmates list 01 December 17.

Using DOC ICE immigration detainer numbers, the following table reveals the number and percentage of criminal alien inmates incarcerated on December 1st that were sent to prison from the state’s 36 counties for drug crimes.
 

OREGON DEPARTMENT OF CORRECTIONS

County

DOC Number of Inmates W/ ICE Detainers by County Incarcerated for Drug Crimes

DOC Percent of Inmates W/ ICE Detainers by County Incarcerated for Drug Crimes

Multnomah

33

34.02%

Washington

18

18.56%

Clackamas

14

14.43%

Jackson

7

7.22%

Marion

7

7.22%

Klamath

3

3.09%

Benton

2

2.06%

Lane

2

2.06%

Malheur

2

2.06%

Umatilla

2

2.06%

Wasco

2

2.06%

Deschutes

1

1.03%

Douglas

1

1.03%

Josephine

1

1.03%

Lake

1

1.03%

Polk

1

1.03%

Baker

0

0.00%

Clatsop

0

0.00%

Columbia

0

0.00%

Coos

0

0.00%

Crook

0

0.00%

Curry

0

0.00%

Gilliam

0

0.00%

Grant

0

0.00%

Harney

0

0.00%

Hood River

0

0.00%

Jefferson

0

0.00%

Lincoln

0

0.00%

Linn

0

0.00%

Morrow

0

0.00%

OOS (Not a County)

0

0.00%

Sherman

0

0.00%

Tillamook

0

0.00%

Union

0

0.00%

Wallowa

0

0.00%

Wheeler

0

0.00%

Yamhill

0

0.00%

Total

97

100.00%

Source: Research and Evaluation DOC Report ICE inmates list 01 December 17.

Using DOC ICE immigration detainer numbers, the following table reveals the self-declared countries of origin of the 97 criminal alien inmates by number and percentage incarcerated on December 1st in the state’s prisons for drug crimes.
 

OREGON DEPARTMENT OF CORRECTIONS

Country

DOC Number of Inmates W/ ICE Detainers by Country Incarcerated for Drug Crimes

DOC Percent of Inmates W/ ICE Detainers by Country Incarcerated for Drug Crimes


Mexico

85

87.63%


Honduras

4

4.12%


El Salvador

2

2.06%


Australia

1

1.03%


Italy

1

1.03%


Laos

1

1.03%


Russia

1

1.03%


Unknown Countries

2

2.06%


Total

97

100.00%


Source: Research and Evaluation DOC Report ICE inmates list 01 December 17.

Criminal aliens from seven different countries have committed drug crimes against residents in the State of Oregon.

David Olen Cross of Salem, Oregon writes on immigration issues and foreign national crime. This report is a service to Oregon state, county and city governmental officials to help them assess the impact of foreign national crime in the state. He can be reached at docfnc@yahoo.com or at http://docfnc.wordpress.com/ Read more about Oregon Department of Corrections: Foreign National Drug Crime Report December 2017

Trump’s Draft Amnesty: Unlimited, Forever, and Before a Wall Is Built

A near-final draft of the White House’s unlimited and forever amnesty bill says the administration wants $25 billion for a wall over the next five years, and will not cancel chain-migration or visa-lottery inflows until the last of the 4 million foreigners now in the pipeline have arrived in the 2030s.

The amnesty is dubbed the Security, Enforcement, and Compassion United Reform Effort Act, or SECURE Act. It is based on the SUCCEED Act developed by Sen. Thom Tillis and Sen. James Lankford, and it offers amnesty to an unlimited number of people, without any ending date.

Overall, the amnesty bill implements the desire of American business for a huge, managed supply of young, compliant, non-criminal workers, who also double as consumers. That is very different from progressives’ desire to welcome poor ‘dreamer’ migrants from developing countries, regardless of costs...

The 250-page draft received by Breitbart News matches the one-page description released this week by White House officials.

The Trump amnesty bill requires $25 billion be set aside from 2018 to 2021 for “tactical infrastructure,” which is a code-word for a wall....

In fact, Democrats who say they will vote for the amnesty and wall also suggest they will try to block subsequent construction of the wall...

The bill technically ends the visa lottery and chain-migration programs which allow diverse immigrants to bring in their extended-family clans of siblings, parents and older children. But the end is delayed until all 4 million people in the pipeline — such as the elderly parents and devout siblings of visa-lottery winners from Pakistan — settle in the United States. The pipeline also includes hundreds of thousands of white-collar professionals.

By welcoming everyone in the pipeline, the bill does not give working Americans even partial relief from the salary impact of mass immigration for 15 years or more...

The amnesty section requires Americans to grant the hugely valuable gift of citizenship to nearly all current illegals who have documents saying they are younger than 37...

The legislation directs the Secretary of the Department of Homeland Security to operate the amnesty and includes some measures to help screen out fraudulent applicants for the amnesty.

For example, the bill includes a grant of $400 million for a formal bureaucratic process...

But the bill sets no upper limit on Trump’s amnesty, and it does not provide any incentives for officials to fight fraud or minimize the scale...

That lack of any upper limit means the political appointee who runs the DHS  will have the power to exceed the reported estimate of 1.8 million illegals by simply directing officials to accept more applications...

The cost of the amnesty is not mentioned in the legislation, although the Congressional Budget Office optimistically estimated that a similar DREAM Act amnesty for 2 million illegals would cost taxpayers $26 billion in just the first ten years. The costs would be high because very few of the illegals have college degrees, many do not speak English, and so cannot earn enough to pay more taxes than they receive in benefits....

The existing population of illegals in the United States is estimated at 12 million, but it may be higher, and it is growing every day as migrants head north in the hope of buying documents and applying for the amnesty...

Moreover, the bill handcuffs DHS agents from deporting any younger illegals until the illegals file for the amnesty. That provision means the DHS agents cannot deport young illegals — even if they have just climbed over the border fence — until the DHS secretary can start accepting applications.

But the business community will have little reason to defend Trump, partly because they have gotten their double-shot of tax cuts and cheap labor. In fact, the legislation does not sunset the amnesty, meaning it can be quietly expanded with a few legal tweaks that can be attached to any of the myriad obscure bills annually passed by Congress.

In 1986, Congress expected that 400,000 farm workers would apply for green cards –but officials eventually handed out 1 million green cards. If the same pattern applies to the estimated 1.8 million recipients, Trump’s amnesty will be given to 4.5 million illegals — or more than one year of births in the United States.

The Migration Policy Institute estimates the current resident population of ‘dreamer’ illegals to be 3.25 million — not counting younger, more recent child-illegals who will age in and drive the total closer to 4.5 million.

That bigger-than-expected total would be a disaster for the GOP but a boon for business because it will head off the labor shortages which allow Americans to get higher wages....

The legislation says illegals must meet several tests, such as steady work and validated education levels. But the education standards are extremely low, suggesting that nearly all illegals will meet the test...

Illegals will be allowed to become citizens after 12 years, giving Democrats a huge electoral boost in the 2030s when nearly all of today’s GOP legislators have retired...

Even without citizenship, the population of several million legalized illegals will provide an immediate gain for Democratic Party, partly because they will be counted in the 2020 census and will shift a few more House seats from GOP-dominated areas into Democratic-dominated areas....

The draft amnesty will also serve as complete proof in November that Trump’s voters’ wrongly placed their trust in his August 2016 promise to block any amnesty:

He said:

For those here illegally today who are seeking legal status, they will have one route and one route only. To return home and apply for re-entry like everybody else under the rules of the new legal immigration system that I have outlined today …

It’s our right as a sovereign nation to choose immigrants that we think are the likeliest to thrive and flourish and love us …

Anyone who tells you the core issue is the needs of those living here illegally has simply spent too much time in Washington.

Four million Americans turn 18 each year and begin looking for good jobs in the free market.

But the federal government inflates the supply of new labor by annually accepting roughly 1.1 million new legal immigrants (including roughly 750,000 working-age migrants), by providing work-permits to roughly 3 million resident foreigners, and by doing little to block the employment of roughly 8 million illegal immigrants.

The Washington-imposed economic policy of economic growth via mass-immigration floods the market with foreign laborspikes profits and Wall Street values by cutting salaries for manual and skilled labor offered by blue-collar and white-collar employees. It also drives up real estate priceswidens wealth-gaps, reduces high-tech investment, increases state and local tax burdens, hurts kids’ schools and college education, pushes Americans away from high-tech careers, and sidelines at least 5 million marginalized Americans and their families, including many who are now struggling with opioid addictions.

amnesty

The cheap-labor policy has also reduced investment and job creation in many interior states because the coastal cities have a surplus of imported labor....

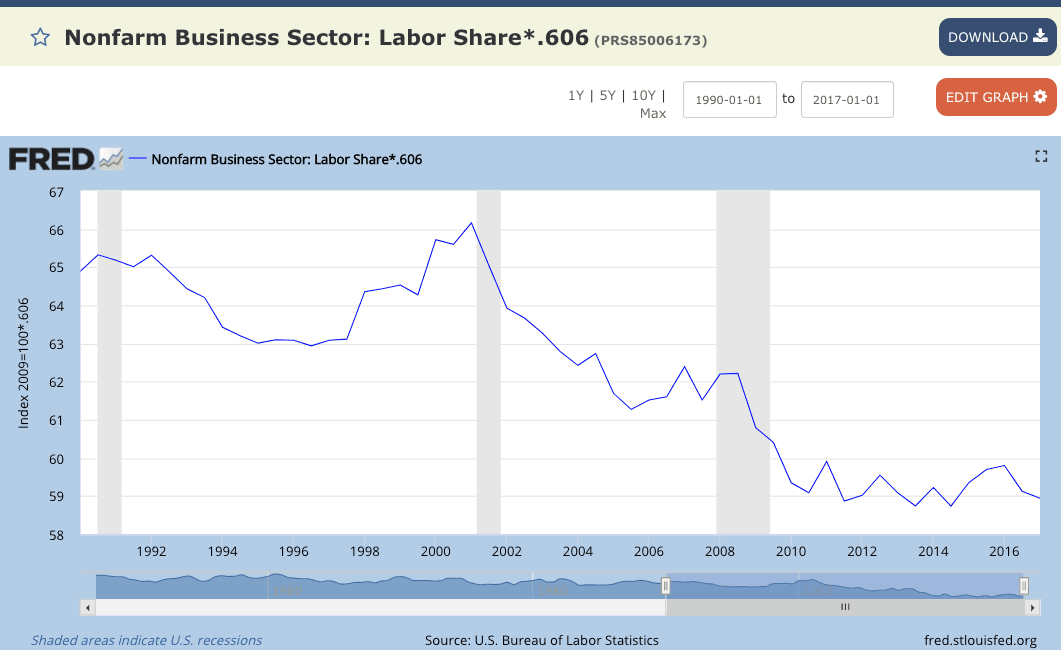
Because of the successful cheap-labor strategy, wages for men have remained flat since 1973, and a large percentage of the nation’s annual income has shifted to investors and away from employees.

amnesty Read more about Trump’s Draft Amnesty: Unlimited, Forever, and Before a Wall Is Built

Oregon Department of Corrections: Foreign National Sex Crime Report December 2017

Information obtained from the Oregon Department of Corrections (DOC) indicated that on December 1, 2017 that 476 of the 973 foreign nationals (criminal aliens) in the state’s prison system were incarcerated for three types of sex crimes (sex abuse, rape and sodomy), 48.92 percent of the criminal alien prison population.

The following table identifies the types, numbers and percentages of sex crimes committed by the 476 criminal aliens with U.S. Immigration and Customs Enforcement (ICE) immigration detainers incarcerated on December 1st in DOC prisons.
 

OREGON DEPARTMENT OF CORRECTIONS

Crime

DOC Number Inmates W/ ICE Detainers Incarcerated by Type of Sex Crime

DOC Percent Inmates W/ICE Detainers Incarcerated by Type of Sex Crime

Sex Abuse

200

42.02%

Rape

175

36.76%

Sodomy

101

21.22%

Total

476

100.00%

Source: Research and Evaluation DOC Report ICE inmates list 01 December 17.

Using DOC ICE detainer numbers, the following table reveals the number and percentage of 476 criminal alien prisoners incarcerated on December 1st that were sent to prison from the state’s 36 counties for the crimes of sex abuse, rape and sodomy.
 

OREGON DEPARTMENT OF CORRECTIONS

County

DOC Number Inmates W/ ICE Detainers by County Incarcerated for the Crime of Sex Abuse

DOC Number Inmates W/ICE Detainers by County Incarcerated for the Crime of Rape

DOC Number Inmates W/ICE Detainers by County Incarcerated for the Crime of Sodomy

DOC Number Inmates W/ICE Detainers by County Incarcerated for Sex Crimes

DOC Percent Inmates W/ICE Detainers by County Incarcerated for Sex Crimes

Marion

51

49

33

133

27.94%

Washington

49

45

22

116

24.37%

Multnomah

32

25

17

74

15.55%

Lane

8

14

5

27

5.67%

Clackamas

12

11

4

27

5.67%

Jackson

10

5

4

19

3.99%

Yamhill

4

7

3

14

2.94%

Deschutes

5

2

3

10

2.10%

Linn

6

1

1

8

1.68%

Benton

2

4

1

7

1.47%

Malheur

4

2

0

6

1.26%

Polk

4

1

1

6

1.26%

Klamath

4

0

0

4

0.84%

Umatilla

1

1

2

4

0.84%

Clatsop

2

1

0

3

0.63%

Coos

0

2

1

3

0.63%

Lincoln

1

1

1

3

0.63%

Hood River

0

2

0

2

0.42%

Jefferson

1

1

0

2

0.42%

Wasco

1

1

0

2

0.42%

Crook

0

0

1

1

0.21%

Douglas

0

0

1

1

0.21%

Josephine

1

0

0

1

0.21%

Morrow

1

0

0

1

0.21%

Tillamook

0

0

1

1

0.21%

Union

1

0

0

1

0.21%

Baker

0

0

0

0

0.00%

Columbia

0

0

0

0

0.00%

Curry

0

0

0

0

0.00%

Gilliam

0

0

0

0

0.00%

Grant

0

0

0

0

0.00%

Harney

0

0

0

0

0.00%

Lake

0

0

0

0

0.00%

OOS

0

0

0

0

0.00%

Sherman

0

0

0

0

0.00%

Wallowa

0

0

0

0

0.00%

Wheeler

0

0

0

0

0.00%

Total

200

175

101

476

100.00%

Source: Research and Evaluation DOC Report ICE inmates list 01 December 17.

Using DOC ICE detainer numbers, the following table reveals the self-declared countries of origin of the criminal alien prisoners by number and percentage incarcerated on December 1st in the state’s prisons for the crimes of sex abuse, rape and sodomy.
 

OREGON DEPARTMENT OF CORRECTIONS

Country

DOC Number Inmates W/ ICE Detainers by Country Incarcerated for the Crime of Sex Abuse

DOC Number Inmates W/ICE Detainers by Country Incarcerated for the Crime of Rape

DOC Number Inmates W/ICE Detainers by Country Incarcerated for the Crime of Sodomy

DOC Number Inmates W/ICE Detainers by Country Incarcerated for Sex Crimes

DOC Percent Inmates W/ICE Detainers by Country Incarcerated for Sex Crimes

Mexico

176

142

80

398

83.61%

Guatemala

5

6

2

13

2.73%

El Salvador

1

3

5

9

1.89%

Russia

1

3

1

5

1.05%

Fed. St. Micron.

2

0

2

4

0.84%

Ecuador

0

1

2

3

0.63%

Honduras

1

2

0

3

0.63%

Ukraine

1

1

1

3

0.63%

Vietnam

0

2

1

3

0.63%

Cuba

1

1

0

2

0.42%

England

1

0

1

2

0.42%

Peru

2

0

0

2

0.42%

Philippines

0

0

2

2

0.42%

Wales

0

2

0

2

0.42%

Other Countries

9

12

4

25

5.25%

Total

200

175

101

476

100.00%

Source: Research and Evaluation DOC Report ICE inmates list 01 December 17.

Criminal aliens from 37 different countries sexually abused, raped and sodomized residents in the State of Oregon.

David Olen Cross of Salem, Oregon writes on immigration issues and foreign national crime. This report is a service to Oregon state, county and city governmental officials to help them assess the impact of foreign national crime in the state. He can be reached at docfnc@yahoo.com or at http://docfnc.wordpress.com/ Read more about Oregon Department of Corrections: Foreign National Sex Crime Report December 2017

Here's how to report suspected criminal alien activity

Alert date: 
January 9, 2018
Alert body: 

Are you aware of suspected criminal activity happening in your neighborhood, workplace or another location. Did you know you can report the information here: https://www.ice.gov/webform/hsi-tip-form Please follow the instructions carefully.
 

County with Sanctuary Cities: Oregon’s Washington County Second in Foreign National Crime in December 2017

On December 1, 2017 Oregon’s Washington County had 202 of the 973 foreign nationals (criminal aliens) incarcerated in the Oregon Department of Corrections (DOC) prison system; the county was Second in foreign national crime in the state with 20.76 percent of the criminal aliens in DOC prisons.

The following table reveals how Washington County residents were harmed or victimized by the 202 criminal aliens incarcerated on December 1st in the DOC prison system with U.S. Immigration and Customs Enforcement (ICE) immigration detainers.
 

OREGON DEPARTMENT OF CORRECTIONS

Crime

Total Number of Inmates W/ ICE Detainers in DOC Prisons from Washington County by Type of Crime

Percentage of Inmates W/ICE Detainers in DOC Prisons from Washington County by Type of Crime

Sex Abuse

49

24.26%

Rape

45

22.28%

Homicide

22

10.89%

Sodomy

22

10.89%

Assault

18

8.91%

Drugs

18

8.91%

Robbery

12

5.94%

Burglary

4

1.98%

Kidnapping

3

1.49%

Theft

3

1.49%

Driving Offense

2

0.99%

Escape

1

0.50%

Arson

0

0.00%

Forgery

0

0.00%

Vehicle Theft

0

0.00%

Other / Combination Crimes

3

1.49%

Total

202

100.00%

Source: Research and Evaluation DOC Report ICE inmates list 01 December 17.

This table reveals, using the DOC ICE detainer numbers from December 1st, the total number of criminal alien inmates incarcerated in the DOC prison system by type of crime from all Oregon counties, the total number of criminal alien inmates from Washington County in DOC prisons by type of crime and the percentage of those alien inmates who were from the county by type of crime.
 

OREGON DEPARTMENT OF CORRECTIONS

Crime

Total number of Inmates W/ ICE Detainers in DOC Prisons from all Oregon Counties by Type of Crime

Total number of Inmates W/ ICE Detainers in DOC Prisons from Washington County by Type of Crime

Percentage of Inmates W/ICE Detainers in DOC Prisons from Washington County by Type of Crime

Sex Abuse

200

49

24.50%

Rape

175

45

25.71%

Homicide

136

22

16.18%

Sodomy

101

22

21.78%

Drugs

97

18

18.56%

Assault

76

18

23.68%

Robbery

52

12

23.08%

Kidnapping

25

3

12.00%

Burglary

23

4

17.39%

Theft

15

3

20.00%

Driving Offense

7

2

28.57%

Vehicle Theft

5

0

0.00%

Escape

1

1

100.00%

Forgery

1

0

0.00%

Arson

0

0

0.00%

Other / Combination Crimes

59

3

5.08%

Total

973

202


Source: Research and Evaluation DOC Report ICE inmates list 01 December 17.

The following table reveals the self-declared countries of origin of the majority of the 202 criminal aliens with ICE immigration detainers who have harmed or victimized the residents Washington County in the DOC prison system.
 

OREGON DEPARTMENT OF CORRECTIONS

Country

Total Inmates W/ ICE Detainers from Washington Country by Country of Origin in DOC Prisons

Percentage of Inmates W/ICE Detainers by Country of Origin from Washington County in DOC Prisons

Mexico

158

78.22%

Guatemala

11

5.45%

Cuba

5

2.48%

EL Salvador

3

1.49%

Honduras

3

1.49%

Federated States of Micronesia

2

0.99%

Philippines

2

0.99%

Other Countries

18

8.91%

Total

202

100.00%

Source: Research and Evaluation DOC Report ICE inmates list 01 December 17.

Criminal aliens from 24 different countries have harmed or victimized the residents of Washington County.

David Olen Cross of Salem, Oregon writes on immigration issues and foreign national crime. This report is a service to Oregon state, county and city governmental officials in Washington County to help them assess the impact of foreign national crime in the county. He can be reached at docfnc@yahoo.com or at http://docfnc.wordpress.com/


  Read more about County with Sanctuary Cities: Oregon’s Washington County Second in Foreign National Crime in December 2017

Sanctuary County: Oregon's Multnomah County Third in Foreign National

On December 1, 2017 Oregon’s Multnomah County had 201 of the 973 foreign nationals (criminal aliens) incarcerated in the Oregon Department of Corrections (DOC) prison system; the county was third in foreign national crime in the state with 20.66 percent of the criminal aliens in DOC prisons.

The following table reveals how Multnomah County residents were harmed or victimized by the 201 criminal aliens incarcerated on December 1st in the DOC prison system with U.S. Immigration and Customs Enforcement (ICE) immigration detainers.
 

OREGON DEPARTMENT OF CORRECTIONS

Crime

Total Number of Inmates W/ ICE Detainers in DOC Prisons from Multnomah County by Type of Crime

Percentage of Inmates W/ICE Detainers in DOC Prisons from Multnomah County by Type of Crime

Homicide

39

19.40%

Drugs

33

16.42%

Sex Abuse

32

15.92%

Rape

25

12.44%

Robbery

21

10.45%

Sodomy

17

8.46%

Assault

16

7.96%

Kidnapping

7

3.48%

Burglary

5

2.49%

Vehicle Theft

2

1.00%

Driving Offense

1

0.50%

Theft

1

0.50%

Arson

0

0.00%

Escape

0

0.00%

Forgery

0

0.00%

Other / Combination Crimes

2

1.00%

Total

201

100.00%

Source: Research and Evaluation DOC Report ICE inmates list 01 December 17.

This table reveals, using the DOC ICE detainer numbers from December 1st, the total number criminal alien inmates incarcerated in the DOC prison system by type of crime from all Oregon counties, the total number of criminal alien inmates from Multnomah County in DOC prisons by type of crime and the percentage of those alien inmates who were from the county by type of crime.
 

OREGON DEPARTMENT OF CORRECTIONS

Crime

Total number of Inmates W/ ICE Detainers in DOC Prisons from all Oregon Counties by Type of Crime

Total number of Inmates W/ ICE Detainers in DOC Prisons from Multnomah County by Type of Crime

Percentage of Inmates W/ICE Detainers in DOC Prisons from Multnomah County by Type of Crime

Sex Abuse

200

32

16.00%

Rape

175

25

14.29%

Homicide

136

39

28.68%

Sodomy

101

17

16.83%

Drugs

97

33

34.02%

Assault

76

16

21.05%

Robbery

52

21

40.38%

Kidnapping

25

7

28.00%

Burglary

23

5

21.74%

Theft

15

1

6.67%

Driving Offense

7

1

14.29%

Vehicle Theft

5

2

40.00%

Escape

1

0

0.00%

Forgery

1

0

0.00%

Arson

0

0

0.00%

Other / Combination Crimes

59

2

3.39%

Total

973

201


Source: Research and Evaluation DOC Report ICE inmates list 01 December 17.

The following table reveals the self-declared countries of origin of the majority of the 201 criminal aliens with ICE immigration detainers who have harmed or victimized the residents Multnomah County in the DOC prison system.
 

OREGON DEPARTMENT OF CORRECTIONS

Country

Total Inmates W/ ICE Detainers from Multnomah Country by Country of Origin in DOC Prisons

Percentage of Inmates W/ICE Detainers by Country of Origin from Multnomah County in DOC Prisons

Mexico

134

66.67%

Vietnam

11

5.47%

Cuba

7

3.48%

Honduras

5

2.49%

Guatemala

4

1.99%

Federated States of Micronesia

4

1.99%

Russia

4

1.99%

Ukraine

3

1.49%

Egypt

2

1.00%

EL Salvador

2

1.00%

England

2

1.00%

Laos

2

1.00%

Other Countries

21

10.45%

Total

201

100.00%

Source: Research and Evaluation DOC Report ICE inmates list 01 December 17.

Criminal aliens from 33 different countries have harmed or victimized the residents of Multnomah County.

David Olen Cross of Salem, Oregon writes on immigration issues and foreign national crime. This report is a service to Oregon state, county and city governmental officials in Multnomah County to help them assess the impact of foreign national crime in the county. He can be reached at docfnc@yahoo.com or at http://docfnc.wordpress.com/ Read more about Sanctuary County: Oregon's Multnomah County Third in Foreign National

Oregon Department of Corrections: Criminal Alien Report December 2017

The Oregon Department of Corrections (DOC) December 1, 2017 Inmate Population Profile indicated there were 14,739 inmates incarcerated in the DOC’s 14 prisons.

Data obtained from the DOC indicated that on December 1st there were 973 foreign nationals (criminal aliens) incarcerated in the state’s prison system; approximately one in every fifteen prisoners incarcerated by the state was a criminal alien, 6.60 percent of the total prison population.

Some background information, all 973 criminal aliens currently incarcerated in the DOC prison system were identified by U.S. Immigration and Customs Enforcement (ICE), a federal law enforcement agency that is part of the U.S. Department of Homeland Security. If an inmate is identified by ICE as being a criminal alien, at the federal law enforcement agency’s request, DOC officials will place an “ICE detainer” on the inmate. After the inmate completes his/her state sanction, prison officials will transfer custody of the inmate to ICE.

Using DOC Inmate Population Profiles and ICE detainer numbers, the following table reveals the total number inmates, the number of domestic and criminal alien inmates along with the percentage of them with ICE detainers incarcerated on December 1st in the state’s prisons.
 

OREGON DEPARTMENT OF CORRECTIONS

Month/Day/Year

DOC Total Inmates

DOC Total Domestic Inmates

DOC Total Inmates W/ICE Detainers

DOC % Inmates W/ICE Detainers

December 1, 2017

14,739

13,766

973

6.60%

Source: Research and Evaluation DOC Report ICE inmates list 01 December 17 and Inmate Population Profile 01 December 17.

Using DOC ICE detainer numbers, the following table reveals the number and percentage of criminal alien prisoners incarcerated on December 1st that were sent to prison from the state’s 36 counties.
 

OREGON DEPARTMENT OF CORRECTIONS

County

DOC Total Inmates W/ ICE Detainers by County

DOC % Inmates W/ICE Detainers by County

Marion

235

24.15%

Washington

202

20.76%

Multnomah

201

20.66%

Clackamas

82

8.43%

Lane

39

4.01%

Jackson

37

3.80%

Yamhill

23

2.36%

Umatilla

22

2.26%

Polk

16

1.64%

Benton

15

1.54%

Klamath

15

1.54%

Linn

14

1.44%

Deschutes

13

1.34%

Malheur

9

0.92%

Lincoln

7

0.72%

Jefferson

5

0.51%

Josephine

5

0.51%

Wasco

5

0.51%

Clatsop

4

0.41%

Coos

4

0.41%

Douglas

4

0.41%

Hood River

4

0.41%

Tillamook

3

0.31%

Columbia

2

0.21%

Union

2

0.21%

Crook

1

0.10%

Gilliam

1

0.10%

Lake

1

0.10%

Morrow

1

0.10%

OOS (Not a County)

1

0.10%

Baker

0

0.00%

Curry

0

0.00%

Grant

0

0.00%

Harney

0

0.00%

Sherman

0

0.00%

Wallowa

0

0.00%

Wheeler

0

0.00%

Total

973

100.00%

Source: Research and Evaluation DOC Report ICE inmates list 01 December 17.

Here are the ways Oregon residents were victimized by the 973 criminal aliens.

Using DOC ICE detainer numbers, the following table reveals the number and percentage of criminal alien prisoners incarcerated on December 1st by type of crime.
 

OREGON DEPARTMENT OF CORRECTIONS

Crime

DOC Total Inmates W/ ICE Detainers by Type of Crime

DOC % Inmates W/ICE Detainers by Type of Crime

Sex Abuse

200

20.55%

Rape

175

17.99%

Homicide

136

13.98%

Sodomy

101

10.38%

Drugs

97

9.97%

Assault

76

7.81%

Robbery

52

5.34%

Kidnapping

25

2.57%

Burglary

23

2.36%

Theft

15

1.54%

Driving Offense

7

0.72%

Vehicle Theft

5

0.51%

Escape

1

0.10%

Forgery

1

0.10%

Arson

0

0.00%

Other / Combination

59

6.06%

Total

973

100.00%

Source: Research and Evaluation DOC Report ICE inmates list 01 December 17.

Using the DOC Inmate Population Profile and ICE detainer numbers from December 1st, the following table reveals the total number inmates by crime type, the number of domestic and criminal alien prisoners incarcerated by type of crime and the percentage of those crimes committed by criminal aliens.
 

OREGON DEPARTMENT OF CORRECTIONS

Crime

DOC Total Inmates by Type of Crime

DOC Total Domestic Inmates by Type of Crime

DOC Total Inmates W/ICE Detainers by Type of Crime

DOC Inmates W/ICE Detainers as a % of Total Inmates by Type of Crime

Sex Abuse

1,731

1,531

200

11.55%

Rape

971

796

175

18.02%

Homicide

1,734

1,598

136

7.84%

Sodomy

1,036

935

101

9.75%

Drugs

836

739

97

11.60%

Assault

2,026

1,950

76

3.75%

Robbery

1,514

1,462

52

3.43%

Kidnapping

280

255

25

8.93%

Burglary

1,299

1,276

23

1.77%

Theft

1,111

1,096

15

1.35%

Driving Offense

217

210

7

3.23%

Vehicle Theft

497

492

5

1.01%

Escape

40

39

1

2.50%

Forgery

47

46

1

2.13%

Arson

72

72

0

0.00%

Other / Combination

1,328

1,269

59

4.44%

Total

14,739

13,766

973


Source: Research and Evaluation DOC Report ICE inmates list 01 December 17 and Inmate Population Profile 01 December 17.

Using DOC ICE detainer numbers, the following table reveals the self-declared countries of origin of the 973 criminal alien prisoners by number and percentage incarcerated on December 1st in the state’s prisons.
 

OREGON DEPARTMENT OF CORRECTIONS

Country

DOC Total Inmates W/ ICE Detainers by Self-Declared Country of Origin

DOC % Inmates W/ICE Detainers by Self-Declared Country of Origin

Mexico

777

79.86%

Guatemala

19

1.95%

Cuba

17

1.75%

El Salvador

15

1.54%

Honduras

14

1.44%

Vietnam

14

1.44%

Federated States of Micronesia

9

0.92%

Russia

9

0.92%

Laos

5

0.51%

Ukraine

5

0.51%

Cambodia

4

0.41%

Marshall Islands

4

0.41%

Peru

4

0.41%

Philippines

4

0.41%

Canada

3

0.31%

Ecuador

3

0.31%

England

3

0.31%

South Korea

3

0.31%

Thailand

3

0.31%

Other/Unknown Countries

58

5.96%

Total

973

100.00%

Source: Research and Evaluation DOC Report ICE inmates list 01 December 17.

Beyond the DOC criminal alien incarceration numbers and incarceration percentages, per county and per crime type, or even country of origin, criminal aliens pose high economic cost on Oregonians.

An individual prisoner incarcerated in the DOC prison system costs the state approximately ($94.55) per day.

The DOC’s incarceration cost for its 973 criminal alien prison population is approximately ($91,997.15) per day, ($643,980.05) per week, and ($33,578,959.75) per year.

Even taking into account fiscal year 2016 U.S. Bureau of Justice Assistance (BJA), U.S. Department of Justice, State Criminal Alien Assistance Program (SCAAP) award of $1,788,075.00, if the State of Oregon receives the same amount of SCAAP funding for fiscal year 2017, the cost to incarcerate 973 criminal aliens to the DOC will be at least ($31,790,884.75). Note: At this point in time there is no indication the U.S. BJA will provide SCAAP awards in 2017.

None of preceding cost estimates for the DOC to incarcerate the 973 criminal aliens includes the dollar amount for legal services (indigent defense), language interpreters, court costs, or victim assistance.

Bibliography

Oregon Department of Corrections Population Profile December 1, 2017:
http://www.oregon.gov/doc/RESRCH/docs/inmate_profile_201712.pdf

Oregon Department of Corrections Population Profile (unpublished MS Excel workbook) titled Incarcerated Criminal Aliens Report dated December 1, 2017.

Oregon Department of Corrections Issue Brief Quick Facts IB-53, January, 2017:
http://www.oregon.gov/doc/OC/docs/pdf/IB-53-Quick%20Facts.pdf

U.S. Bureau of Justice Assistance, State Criminal Alien Assistance Program (SCAAP), 2016 SCAAP award: https://www.bja.gov/funding/FY2016-SCAAP-Award-C.PDF

David Olen Cross of Salem, Oregon writes on immigration issues and foreign national crime. This report is a service to Oregon state, county and city governmental officials to help them assess the impact of foreign national crime in the state. He can be reached at docfnc@yahoo.com or at http://docfnc.wordpress.com/ Read more about Oregon Department of Corrections: Criminal Alien Report December 2017

Pages

Subscribe to RSS - ICE