crime

Oregon’s Multnomah County Third in Foreign National Crime in January 2018

On January 1, 2018 Oregon’s Multnomah County had 202 of the 967 foreign nationals (criminal aliens) incarcerated in the Oregon Department of Corrections (DOC) prison system; the county was third in foreign national crime in the state with 20.89 percent of the criminal aliens in DOC prisons.

The following table reveals how Multnomah County residents were harmed or victimized by the 202 criminal aliens incarcerated on January 1st in the DOC prison system with U.S. Immigration and Customs Enforcement (ICE) ICE detainers.
 

OREGON DEPARTMENT OF CORRECTIONS

Crime

Total Number of Inmates W/ ICE Detainers in DOC Prisons from Multnomah County by Type of Crime

Percentage of Inmates W/ICE Detainers in DOC Prisons from Multnomah County by Type of Crime

Homicide

39

19.31%

Drugs

33

16.34%

Sex Abuse

32

15.84%

Rape

26

12.87%

Robbery

21

10.40%

Sodomy

17

8.42%

Assault

15

7.43%

Kidnapping

8

3.96%

Burglary

6

2.97%

Vehicle Theft

2

0.99%

Theft

1

0.50%

Arson

0

0.00%

Driving Offense

0

0.00%

Escape

0

0.00%

Forgery

0

0.00%

Other / Combination Crimes

2

0.99%

Total

202

100.00%

Source: Research and Evaluation DOC Report ICE inmates list 01 January 18.

This table reveals, using the DOC ICE detainer numbers from January 1st, the total number criminal alien inmates incarcerated in the DOC prison system by type of crime from all Oregon counties, the total number of criminal alien inmates from Multnomah County in DOC prisons by type of crime and the percentage of those alien inmates who were from the county by type of crime.
 

OREGON DEPARTMENT OF CORRECTIONS

Crime

Total number of Inmates W/ ICE Detainers in DOC Prisons from all Oregon Counties by Type of Crime

Total number of Inmates W/ ICE Detainers in DOC Prisons from Multnomah County by Type of Crime

Percentage of Inmates W/ICE Detainers in DOC Prisons from Multnomah County by Type of Crime

Sex Abuse

199

32

16.08%

Rape

176

26

14.77%

Homicide

137

39

28.47%

Sodomy

100

17

17.00%

Drugs

97

33

34.02%

Assault

74

15

20.27%

Robbery

52

21

40.38%

Kidnapping

26

8

30.77%

Burglary

23

6

26.09%

Theft

14

1

7.14%

Driving Offense

5

0

0.00%

Vehicle Theft

5

2

40.00%

Escape

1

0

0.00%

Forgery

1

0

0.00%

Arson

0

0

0.00%

Other / Comb. Crimes

57

2

3.51%

Total

967

202


Source: Research and Evaluation DOC Report ICE inmates list 01 January 18.

The following table reveals the self-declared countries of origin of the majority of the 202 criminal aliens with ICE detainers who have harmed or victimized the residents Multnomah County in the DOC prison system.
 

OREGON DEPARTMENT OF CORRECTIONS

Country

Total Inmates W/ ICE Detainers from Multnomah Country by Country of Origin in DOC Prisons

Percentage of Inmates W/ICE Detainers by Country of Origin from Multnomah County in DOC Prisons

Mexico

133

65.84%

Vietnam

11

5.45%

Cuba

8

3.96%

Honduras

5

2.48%

Federated States of Micronesia

4

1.98%

Guatemala

4

1.98%

Russia

4

1.98%

Laos

3

1.49%

Egypt

2

0.99%

EL Salvador

2

0.99%

England

2

0.99%

Ukraine

2

0.99%

Other Countries

22

10.89%

Total

202

100.00%

Source: Research and Evaluation DOC Report ICE inmates list 01 January 18.

Criminal aliens from 33 different countries have harmed or victimized the residents of Multnomah County.

David Olen Cross of Salem, Oregon is crime researcher who writes on immigration issues and foreign national crime. The preceding report is a service to Oregon state, county and city governmental officials to help them assess the impact of foreign national crime in the state. He can be reached at docfnc@yahoo.com. His past crime reports can be found at http://docfnc.wordpress.com/. Read more about Oregon’s Multnomah County Third in Foreign National Crime in January 2018

Oregon’s Washington County Second in Foreign National Crime in January 2018

On January 1, 2018 Oregon’s Washington County had 203 of the 967 foreign nationals (criminal aliens) incarcerated in the Oregon Department of Corrections (DOC) prison system; the county was third in foreign national crime in the state with 20.99 percent of the criminal aliens in DOC prisons.

The following table reveals how Washington County residents were harmed or victimized by the 203 criminal aliens incarcerated on January 1st in the DOC prison system with U.S. Immigration and Customs Enforcement (ICE) ICE detainers.
 

OREGON DEPARTMENT OF CORRECTIONS

Crime

Total Number of Inmates W/ ICE Detainers in DOC Prisons from Washington County by Type of Crime

Percentage of Inmates W/ICE Detainers in DOC Prisons from Washington County by Type of Crime

Sex Abuse

50

24.63%

Rape

45

22.17%

Homicide

22

10.84%

Sodomy

21

10.34%

Drugs

19

9.36%

Assault

18

8.87%

Robbery

12

5.91%

Burglary

4

1.97%

Kidnapping

3

1.48%

Theft

3

1.48%

Driving Offense

2

0.99%

Escape

1

0.49%

Arson

0

0.00%

Forgery

0

0.00%

Vehicle Theft

0

0.00%

Other / Combination Crimes

3

1.48%

Total

203

100.00%

Source: Research and Evaluation DOC Report ICE inmates list 01 January 18.

This table reveals, using the DOC ICE detainer numbers from January 1st, the total number of criminal alien inmates incarcerated in the DOC prison system by type of crime from all Oregon counties, the total number of criminal alien inmates from Washington County in DOC prisons by type of crime and the percentage of those alien inmates who were from the county by type of crime.
 

OREGON DEPARTMENT OF CORRECTIONS

Crime

Total number of Inmates W/ ICE Detainers in DOC Prisons from all Oregon Counties by Type of Crime

Total number of Inmates W/ ICE Detainers in DOC Prisons from Washington County by Type of Crime

Percentage of Inmates W/ICE Detainers in DOC Prisons from Washington County by Type of Crime

Sex Abuse

199

50

25.13%

Rape

176

45

25.57%

Homicide

137

22

16.06%

Sodomy

100

21

21.00%

Drugs

97

19

19.59%

Assault

74

18

24.32%

Robbery

52

12

23.08%

Kidnapping

26

3

11.54%

Burglary

23

4

17.39%

Theft

14

3

21.43%

Driving Offense

5

2

40.00%

Vehicle Theft

5

0

0.00%

Escape

1

1

100.00%

Forgery

1

0

0.00%

Arson

0

0

0.00%

Other / Comb. Crimes

57

3

5.26%

Total

967

203


Source: Research and Evaluation DOC Report ICE inmates list 01 January 18.

The following table reveals the self-declared countries of origin of the majority of the 203 criminal aliens with ICE detainers who have harmed or victimized the residents Washington County in the DOC prison system.
 

OREGON DEPARTMENT OF CORRECTIONS

Country

Total Inmates W/ ICE Detainers from Washington Country by Country of Origin in DOC Prisons

Percentage of Inmates W/ICE Detainers by Country of Origin from Washington County in DOC Prisons

Mexico

159

78.33%

Guatemala

11

5.42%

Cuba

5

2.46%

EL Salvador

3

1.48%

Honduras

3

1.48%

Federated States of Micronesia

2

0.99%

Philippines

2

0.99%

Other Countries

18

8.87%

Total

203

100.00%

Source: Research and Evaluation DOC Report ICE inmates list 01 January 18.

Criminal aliens from 24 different countries have harmed or victimized the residents of Washington County.

David Olen Cross of Salem, Oregon is crime researcher who writes on immigration issues and foreign national crime. The preceding report is a service to Oregon state, county and city governmental officials to help them assess the impact of foreign national crime in the state. He can be reached at docfnc@yahoo.com. His past crime reports can be found at http://docfnc.wordpress.com/. Read more about Oregon’s Washington County Second in Foreign National Crime in January 2018

Oregon’s Marion County First in Foreign National Crime in January 2018

On January 1, 2018 Oregon’s Marion County had 233 of the 967 foreign nationals (criminal aliens) incarcerated in the Oregon Department of Corrections (DOC) prison system; the county was first in foreign national crime in the state with 24.10 percent of the criminal aliens in DOC prisons.

The following table reveals how Marion County residents were harmed or victimized by the 233 criminal aliens incarcerated on January 1st in the DOC prison system with U.S. Immigration and Customs Enforcement (ICE) ICE detainers.
 

OREGON DEPARTMENT OF CORRECTIONS

Crime

Total Number of Inmates W/ ICE Detainers in DOC Prisons from Marion County by Type of Crime

Percentage of Inmates W/ICE Detainers in DOC Prisons from Marion County by Type of Crime

Sex Abuse

                                 51

21.89%

Rape

50

21.46%

Sodomy

33

14.16%

Homicide

23

9.87%

Assault

17

7.30%

Kidnapping

10

4.29%

Robbery

8

3.43%

Burglary

6

2.58%

Drugs

6

2.58%

Theft

3

1.29%

Driving Offense

1

0.43%

Vehicle Theft

1

0.43%

Arson

0

0.00%

Escape

0

0.00%

Forgery

0

0.00%

Other / Combination Crimes

24

10.30%

Total

233

100.00%

Source: Research and Evaluation DOC Report ICE inmates list 01 January 18.

This table reveals, using the DOC ICE detainer numbers from January 1st, the total number of criminal alien inmates incarcerated in the DOC prison system by type of crime from all Oregon counties, the total number of criminal alien inmates from Marion County in DOC prisons by type of crime and the percentage of those alien inmates who were from the county by type of crime.
<!--[if !supportLineBreakNewLine]-->
<!--[endif]-->

OREGON DEPARTMENT OF CORRECTIONS

Crime

Total number of Inmates W/ ICE Detainers in DOC Prisons from all Oregon Counties by Type of Crime

Total number of Inmates W/ ICE Detainers in DOC Prisons from Marion County by Type of Crime

Percentage of Inmates W/ICE Detainers in DOC Prisons from Marion County by Type of Crime

Sex Abuse

199

51

25.63%

Rape

176

50

28.41%

Homicide

137

23

16.79%

Sodomy

100

33

33.00%

Drugs

97

6

6.19%

Assault

74

17

22.97%

Robbery

52

8

15.38%

Kidnapping

26

10

38.46%

Burglary

23

6

26.09%

Theft

14

3

21.43%

Driving Offense

5

1

20.00%

Vehicle Theft

5

1

20.00%

Escape

1

0

0.00%

Forgery

1

0

0.00%

Arson

0

0

0.00%

Other / Comb. Crimes

57

24

42.11%

Total

967

233


Source: Research and Evaluation DOC Report ICE inmates list 01 January 18.

The following table reveals the self-declared countries of origin of the majority of the 233 criminal aliens with ICE detainers who have harmed or victimized the residents of Marion County in the DOC prison system.
 

OREGON DEPARTMENT OF CORRECTIONS

Country

Total Inmates W/ ICE Detainers from Marion Country by Country of Origin in DOC Prisons

Percentage of Inmates W/ICE Detainers by Country of Origin from Marion County in DOC Prisons

Mexico

206

88.41%

Federated States of Micronesia

3

1.29%

Russia

3

1.29%

Cambodia

2

0.86%

El Salvador

2

0.86%

Marshall Islands

2

0.86%

Other Countries

15

6.44%

Total

233

100.00%

Source: Research and Evaluation DOC Report ICE inmates list 01 January 18.

Criminal aliens from 19 different countries have harmed or victimized the residents of Marion County.

David Olen Cross of Salem, Oregon is crime researcher who writes on immigration issues and foreign national crime. The preceding report is a service to Oregon state, county and city governmental officials to help them assess the impact of foreign national crime in the state. He can be reached at docfnc@yahoo.com. His past crime reports can be found at http://docfnc.wordpress.com/. Read more about Oregon’s Marion County First in Foreign National Crime in January 2018

MS-13 Resurgence: Immigration Enforcement Needed to Take Back Our Streets

The Trump administration has declared war on MS-13, the notoriously brutal gang based in El Salvador. A similar initiative launched by the Bush administration in 2005 stifled the gang's activity after several years, but the gang has been able to rebuild itself here since 2012.

Center researchers reviewed more than 500 cases of MS-13 gang members arrested nationwide since 2012. We conclude that this resurgence represents a very serious threat to public safety in communities where MS-13 has rebuilt itself. The resurgence is directly connected to the illegal arrival and resettlement of more than 300,000 Central American youths and families that has continued unabated for six years, and to a de-prioritization of immigration enforcement in the interior of the country that occurred at the same time.

All criminal gangs are a threat to public safety, but MS-13 is a unique problem because of the unusually brutal crimes its members have committed, its success in using intimidation to victimize and control people in its territory, and its focus on recruiting young members, often in schools.

Nevertheless, because such a large share of MS-13 members are not citizens, they are especially vulnerable to law enforcement, and many can be removed from the communities they terrorize. Strategic use of immigration enforcement is a necessary element to disrupting and dismantling MS-13 gangs and any other transnational criminal organization operating in our communities.

The proliferation of sanctuary policies that interfere with cooperation between state and local law enforcement agencies threatens to hamper efforts to stifle MS-13 activity. The federal government must take steps to clarify how federal law permits such cooperation and also must set up consequences for those jurisdictions and officials who impose sanctuary policies.

Key findings:

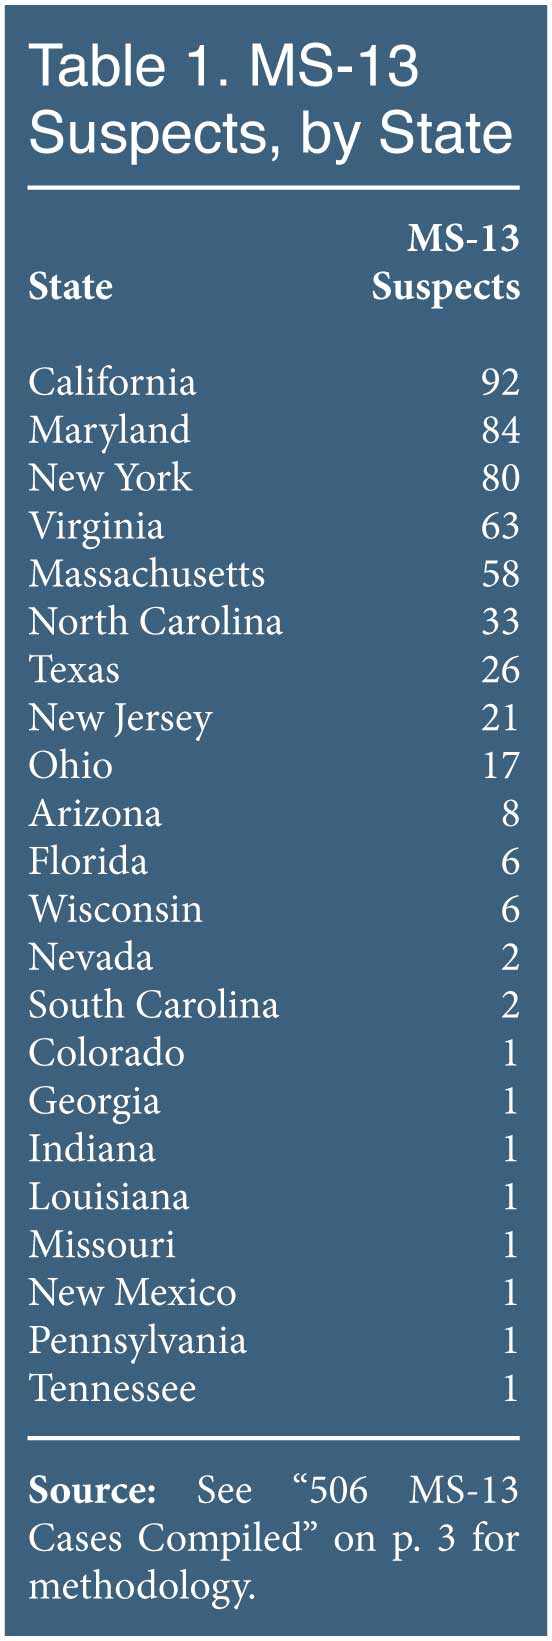
  • We found 506 MS-13 members arrested or charged with crimes that were reported in 22 states. The most cases were reported in California (92), Maryland (85), New York (80), and Virginia (63).
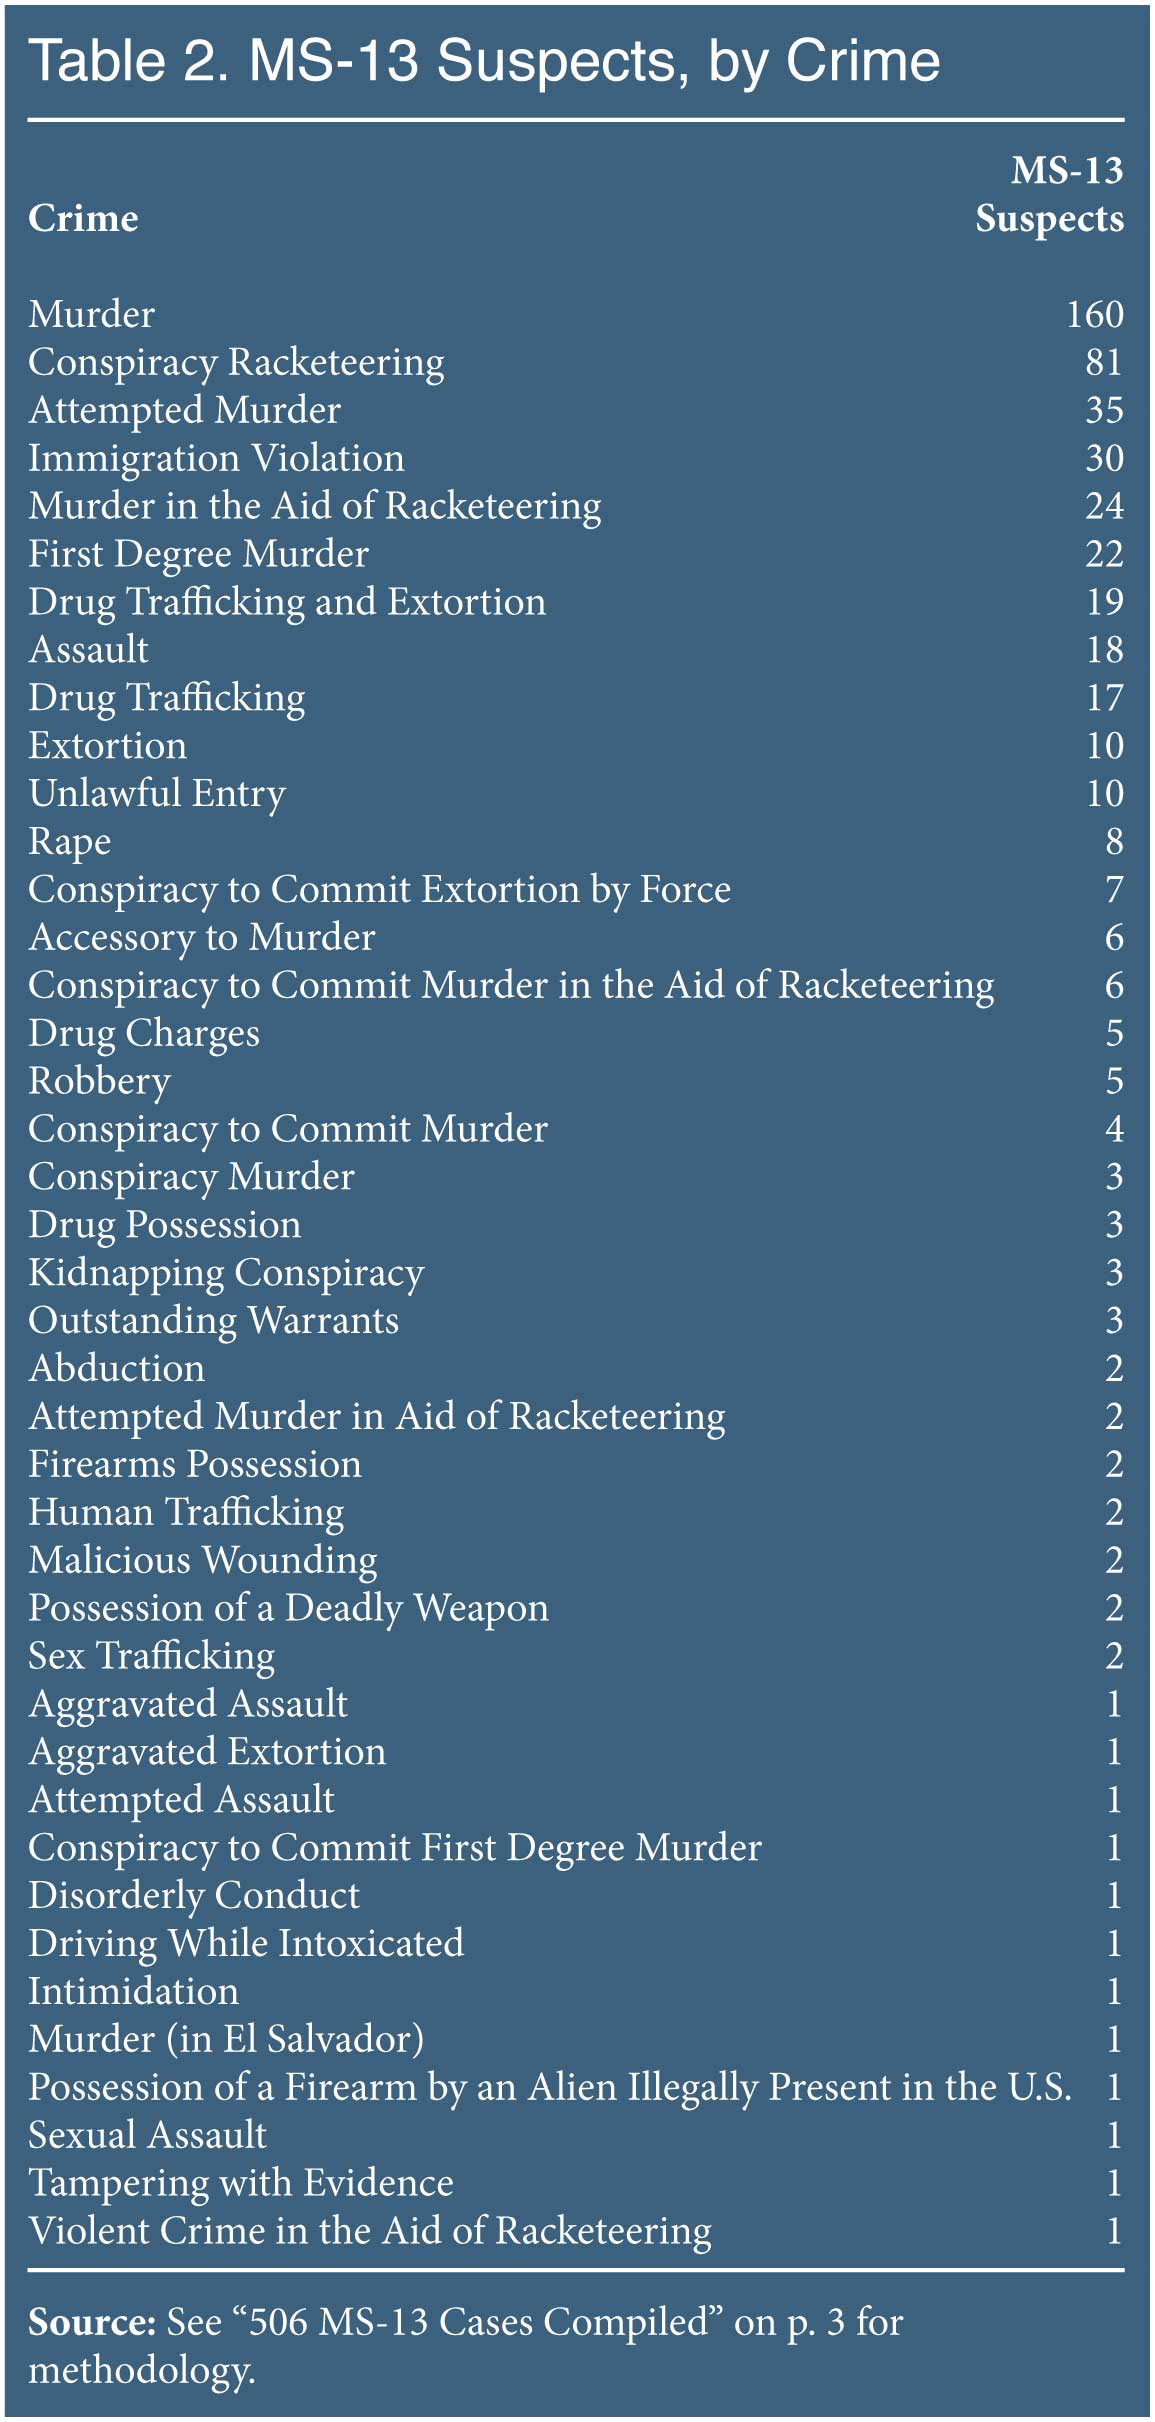
  • MS-13 crimes are not primarily petty nuisance crimes; 207 MS-13 members were charged with murder. In addition we found more than 100 accused of conspiracy/racketeering, and dozens of others for drug trafficking, sex trafficking, attempted murder, sexual assaults, and extortion.
  • While most of the reports of MS-13 suspects in our case set did not include information on the immigration status of the individual, we could determine that 126 of the 506 suspects (and 38 of the 207 murder suspects) were illegal aliens.
  • The median age of MS-13 gang members identified was 23, and suspects ranged in age from 14 to 57.
  • The median age of their victims was 19, and victims ranged in age from 14 to 74. Sixty of the victims were under the age of 18, including 52 of the murder victims.
  • 120 of the 506 MS-13 suspects in our case set arrived as UACs (Unaccompanied Alien Children), including 48 of the murder suspects.
  • The location of these MS-13 crimes corresponds with locations of large numbers of UACs who were resettled by the federal government.

MS-13 Crime in the United States Has Rebounded. Federal and state law enforcement agencies around the country have expressed concern about the resurgence of crime and violence attributed to the MS-13 gang. The gang activity subsided for a time following successful disruption and dismantling efforts, including ICE's Operation Community Shield, which began in 2005. A key element in that success was the assertive use of immigration law enforcement tools.1 Immigration and Customs Enforcement (ICE) agents participated in regional gang task forces led by local law enforcement agencies, ICE field offices launched operations with the help of local agencies, ICE encouraged the formation of 287(g) partnerships to delegate immigration enforcement authority to local gang unit officers, and ICE worked to target individual gang members who were identified by local agencies, even in sanctuary jurisdictions like San Francisco and Miami. Documented gang members often were arrested on administrative immigration violations, which had the effect of disrupting the gang's activities and ridding communities of troublemakers. In addition, these lower-level arrests often led to more significant criminal investigations of gang leaders and the dismantling of local MS-13 cliques.

The Obama administration revised these policies, however, and ICE field offices were directed to cease efforts to disrupt gangs by arresting members for immigration violations or minor crimes and instead focus on major conspiracy cases. ICE officers were no longer permitted to arrest and remove foreign gang members until they had been convicted of major crimes. Gang arrests by ICE plummeted from about 4,600 in 2012 to about 1,580 in 2014.

This de-prioritization of anti-gang enforcement by ICE corresponded to an influx of unaccompanied youths and families arriving illegally from Central America, which began in 2012. During this surge, the Border Patrol has apprehended more than 300,000 UACs and families. Under Obama administration policies, most of the families were released and allowed to continue to their destination, with orders to appear for immigration court proceedings that would take place years in the future, but most have absconded from the process. The Obama administration also adopted a lenient interpretation of the law with respect to UACs, most of whom were males between the ages of 13 and 17, and who were quickly resettled with sponsors, usually family members who were already residing here illegally; some were released to non-family sponsors.2 The government has made almost no effort to monitor or keep track of these individuals. According to DHS, about two-thirds of the youths who were permitted to resettle here as UACs have applied for green cards under a special program for juveniles who claim to have experienced hardship or been abandoned by one of their parents.3

Beginning in 2015, law enforcement agencies across the country began to express concerns about the renewal of MS-13 activity in a number of locations.

For instance, the Texas Department of Public Safety determined that MS-13 had again become a top-tier public safety threat in 2015, on par with larger established gangs, noting the increasing numbers of illegal alien members arriving in Texas and an increase in violent crime associated with it:

Mara Salvatrucha (MS-13) has emerged as a top tier gang threat in Texas for 2015. The influx of illegal alien gang members crossing the border into Texas in 2014, along with reports of extremely violent murders committed by its members in the Houston area, positions the gang as one of the most significant gang threats in the state for this upcoming year.

Since 2011, the number of MS-13 members encountered by U.S. Border Patrol in the Rio Grande Valley (RGV) sector has increased each year, accelerating in 2014 and coinciding with increased illegal migration from Central America during the same period.

Although a large number of MS-13 members have been captured along the border, it is likely many more have successfully crossed into Texas and remain hidden from law enforcement. Gang members from Guatemala, Honduras, and

El Salvador could be destined for locations in Texas with large Central American communities, including the Houston and Dallas areas. Law enforcement agencies in Houston already report the highest number of identified MS-13 members in the state. …

Several recent crimes in Texas illustrate the criminal threat associated with MS-13.

  • On September 15, 2014, the mutilated body of a 14-year-old middle school student was discovered in the woods near Houston after he was murdered with a machete. … In October 2014, a 14-year-old and three adult males were arrested and charged with murder in this case. The adult males are from El Salvador, and at least two are documented MS-13 gang members. ...
  • In mid-August 2014, a 29-year-old 18th Street gang member was stabbed to death in Houston by a 16-year-old El Salvadoran member of MS-13…. According to investigators, the juvenile suspect revealed he illegally crossed into the U.S. in March 2014.4

MS-13 remains listed as at top-tier threat in the 2017 edition of the report, stating that while the illegal border influx has declined “slightly” since 2014, and that while state law enforcement agencies have made some progress, its transnational activity is still a major public safety problem for the state.5

Other state law enforcement agencies report similarly significant increases in MS-13 crime. The Montgomery County, Md., corrections head says the number of incarcerated MS-13 members has risen 20 percent, straining their ability to maintain order. Suffolk County, N.Y., reports a similar rise over the last two years. Prince William County, Va., reports a 32 percent increase in two years, and next-door Fairfax County says their MS-13 inmate population has doubled in the last year.6

506 MS-13 Cases Compiled. Using simple internet searches, Center researchers found 506 cases of MS-13 members arrested or charged with crimes since 2012. We compiled information on the name of the suspect, location of arrest, country of citizenship, age, offense, victim's name and age, and immigration history.

The map below represents the Center's review of these cases. For the purposes of the map, the accused were grouped into a single point when related, such as when multiple members were arrested for a single murder or were part of a racketeering indictment. The points were then color-coded under four general crime categories:

  1. Murder and Attempted Murder
  2. Sex Crimes
  3. Assault and Violent Crime
  4. Other Crimes.

Though a single point may be marked as a "Murder or Attempted Murder", this does not preclude the offender(s) from having committed crimes not related to murder. For details on each individual represented on the map, please download our complete list of MS-13 criminals.

This set of cases is not a full representation of MS-13 activity throughout the country during this time period, of course. Nevertheless, it gives an indication of the scale of the problem and the direct connection to immigration policy....

 MS-13 Suspects by State

MS-13 Arrests Occurred Across the Country, but Are Concentrated in UAC Settlement Areas. The cases we identified were located in 22 different states. The state with the most reported arrests was California (92), followed by Maryland (84), New York (80), and Virginia (63). Table 1 shows the arrests by state.

The arrests occurred primarily in urban or suburban locations, like Boston, Charlotte, Fairfax County, Va., and Brentwood, N.Y., but also in a number of relatively rural areas, like Frederick County, Md., Lynchburg, Va., and Seneca County, Ohio.

The parts of the country that have experienced an increase in MS-13 activity correspond roughly to the areas where there have been the largest number of UAC resettlement placements by the federal government.7 This makes sense; about 15 years ago, MS-13 made a push to expand from Los Angeles to other parts of the country with sizeable Central American communities, including many illegal aliens. Most of the MS-13 members also were in the country illegally.8 These same communities have been the destination of the recent UAC arrivals, who were joining family and friends who had arrived earlier.9

207 MS-13 Murders. The MS-13 members identified in the cases we found were accused of very serious crimes, including 207 murders. More than 100 were accused of conspiracy/racketeering, and dozens of others were charged with drug trafficking, sex trafficking, attempted murder, sexual assaults, and extortion.

We understand that it is the most serious crimes that are most likely to be reported in the news media and by prosecutors. Nevertheless, in the aggregate, this compilation of cases is alarming, and confirms the severity of the public safety threat posed by MS-13.

At a recent roundtable of officials convened at the White House by President Trump on February 6, 2018, to discuss the MS-13 problem, Rep. Peter King (R-N.Y.) said that MS-13 members had committed 17 murders in an 18-month period, representing 38 percent of all homicides in his district. According to investigators, the number of MS-13-related murders in Montgomery County, Md., has gone from about one a year to seven in the last two years.10

Table 2 presents the most serious criminal charges or offenses for each case in our set.

 MS-13 Suspects by Cime

Many MS-13 Members Are Foreign Nationals, Often Here Illegally. The MS-13 gang was formed by illegal aliens from El Salvador who settled in Los Angeles in the 1980s, along with hundreds of thousands of others from Central America. A number of the founding members of MS-13 fought with guerilla and paramilitary groups and participated in violence in El Salvador before relocating to the United States. They held their own in the California gang environments and succeeded in carving out a niche for criminal activity, cultivating a reputation for brutality, intimidation, and zero tolerance for informants or snitching. They recruited new members aggressively, primarily other citizens of El Salvador or the children of Salvadoran migrants. Federal authorities estimated that in its heyday, 90 percent of the MS-13 members were in the country illegally.

ICE and other law enforcement agencies moved aggressively against MS-13 beginning in 2005, seeking to disrupt activities, arrest, prosecute and deport gang members and associates where possible, and dismantle individual cliques and criminal enterprises. The gang's strength was significantly diminished and soon ICE shifted focus to other gangs it considered to be a greater threat.

Today, a smaller percentage of MS-13 members is believed to be here illegally. Some are U.S.-born, others have obtained green cards or have Temporary Protected Status; some have Deferred Action For Childhood Arrivals (DACA). But when the gang leadership decided to launch a more concerted effort to enlarge in the United States, it was able to take advantage of the Obama administration's catch-and-release policies for unaccompanied minors apprehended at the border to move in younger members from Central America. For example, one MS-13 clique leader in Frederick, Md., who had received a DACA work permit and was employed as a custodian at a middle school in Frederick, Md., and who was recently incarcerated for various gang-related crimes, reportedly was told by gang leaders in El Salvador to take advantage of the lenient policies on UACs to bring in new recruits, knowing that they would be allowed to resettle in the area with few questions asked. Several of these unaccompanied minors now have been arrested and incarcerated for various crimes, including a vicious random attack on a sheriff's deputy in 2015.

In addition, the influx of tens of thousands of teenagers, mostly male, into areas where the gang already had a presence, provided a large pool of youths from which to recruit new members. According to local gang investigators, these gangs have been aggressively recruiting recently arrived Central American children as young as 10 years old.

While most of the reports of MS-13 suspects in our case set did not include information on the immigration status of the individual, in 126 of the 506 cases (and in 38 of the 207 murder cases) we were able to determine that the suspect was an illegal alien.

According to ICE, 30 percent of the MS-13 members that ICE has arrested in recent years are UACs. We could determine that 120 of the 507 MS-13 arrests in our case set arrived as UACs, including 48 of the murder suspects.

Not all of the reports included information on the suspect's country of citizenship, but of those that included this information, 88 percent were from El Salvador. The rest were citizens of Guatemala, Honduras, and Mexico.

MS-13 Suspects Were Young, but their Victims Were Younger. Nearly all of the reports we found included information on the age of the MS-13 suspect at the time of arrest. In these cases, the age of the gang members ranged from 14 to 57, with a median age of 23. (See Figure 1.)

 Ages of MS-13 Suspects and Victims

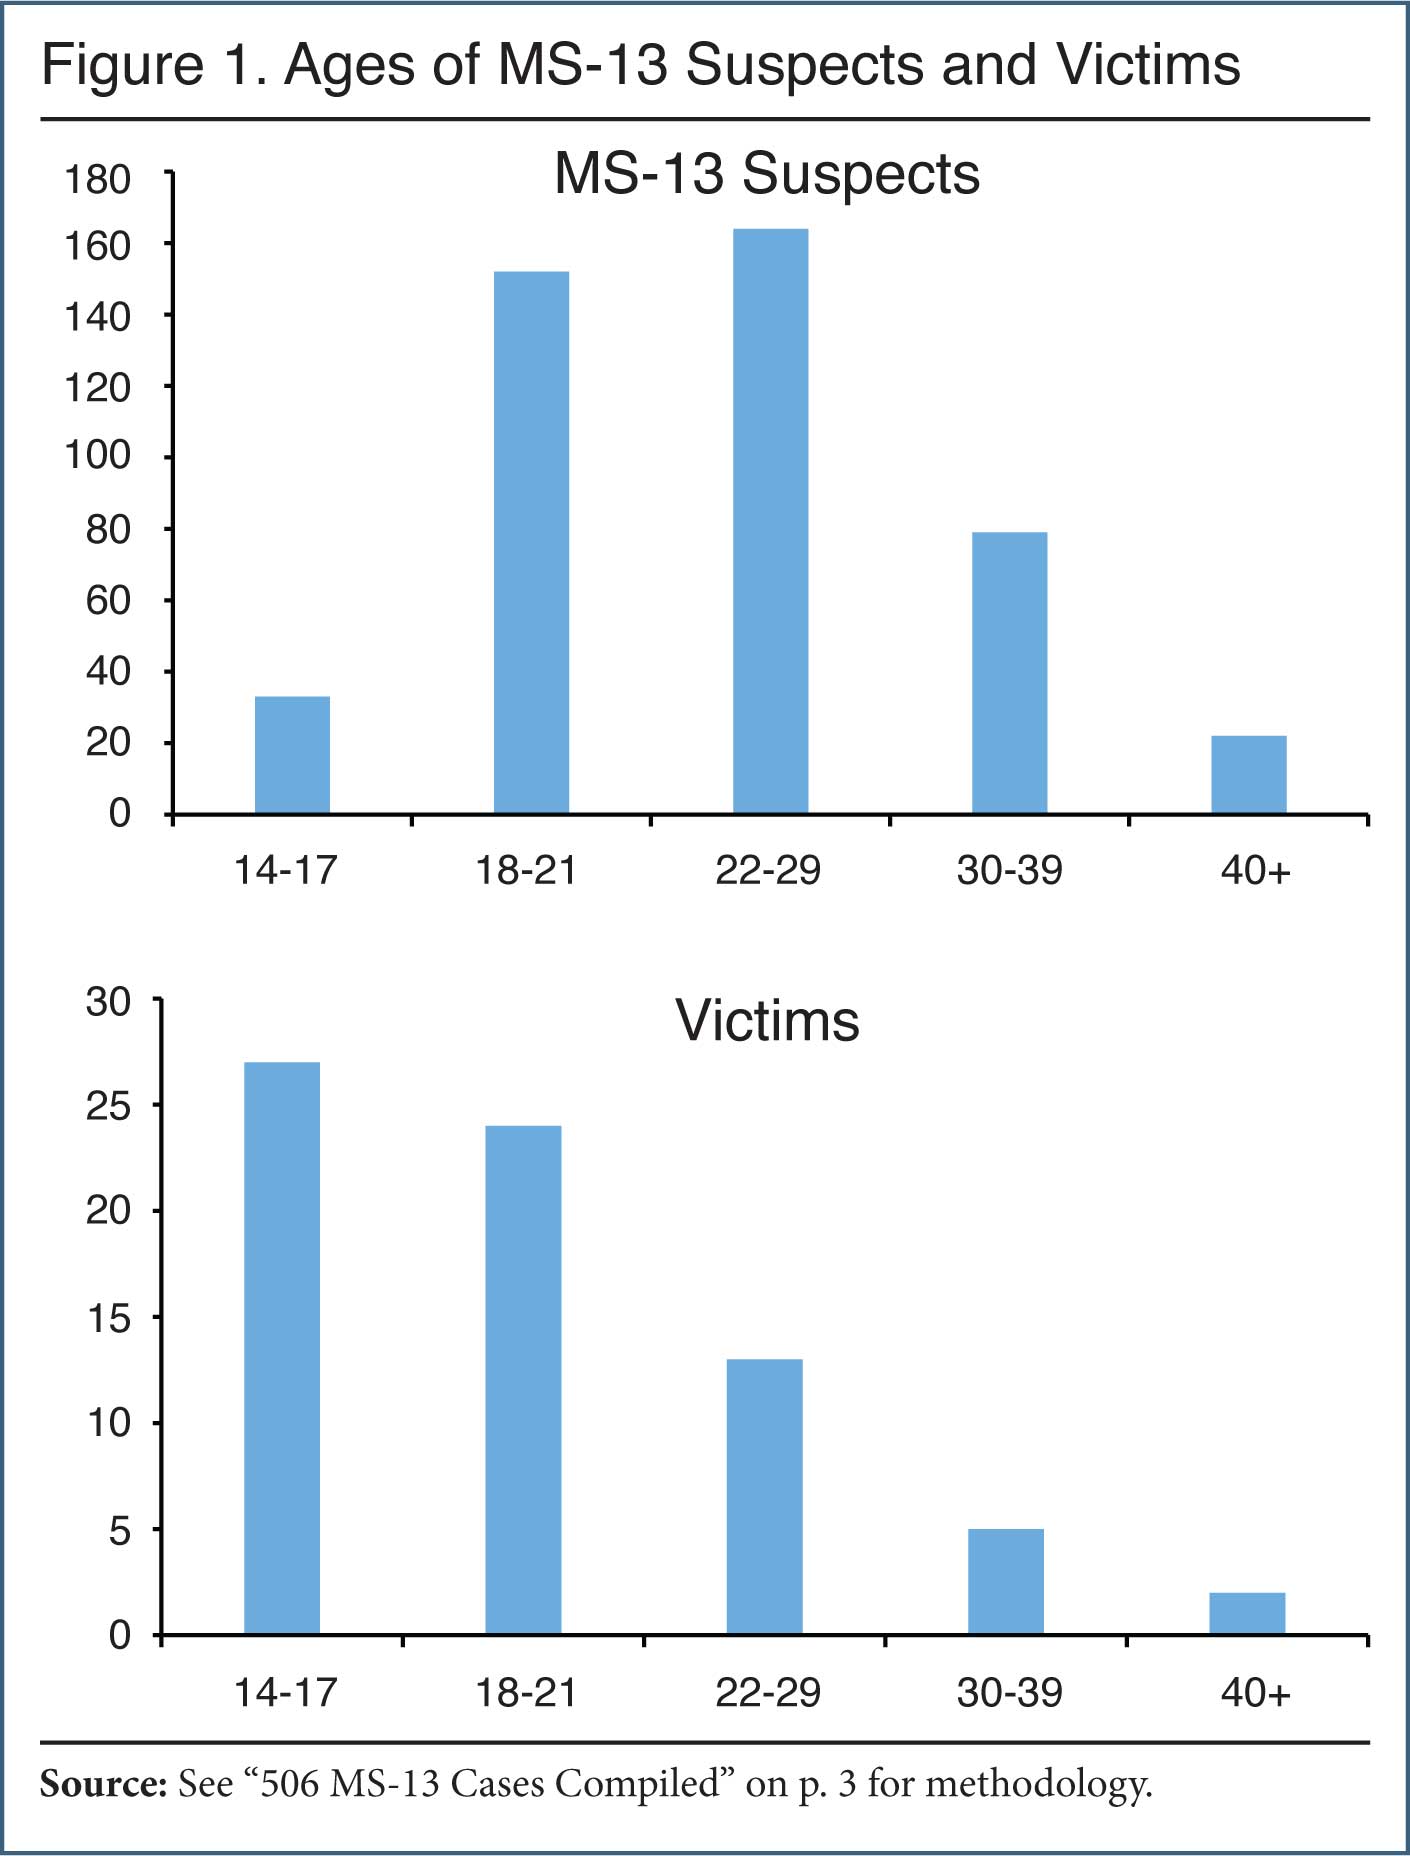
Information on the victims of the crimes was provided in 164 of the cases. They ranged in age from 14 to 74, with a median age of 19. Sixty of the victims were under the age of 18, including 52 of the murder victims.

The Proliferation of Sanctuaries May Complicate Disruption of MS-13. Many of the hotbeds of MS-13 activity are also places where local officials have adopted sanctuary policies. These policies prevent ICE from working effectively with local law enforcement agencies. There are approximately 300 sanctuary jurisdictions in the country, and they include municipalities, counties, and states.11 About half of the MS-13 arrests in our case set (222) occurred in sanctuary jurisdictions.

In addition to information and intelligence, ICE and other immigration agencies have unique immigration authorities that can be particularly effective in addressing criminal activity from transnational gangs. These authorities include the ability to charge criminal aliens with immigration violations such as illegal entry, overstaying a visa, re-entry after deportation, failure to appear for immigration proceedings, illegal possession of a firearm, identity or document fraud, immigration fraud, alien smuggling, immigration charges based on prior commission of serious crimes (aggravated felonies) and other prosecutorial tools.12

Sanctuary policies are destructive to local and federal efforts to combat gangs because they interfere with communication and cooperation that could lead to disruption and dismantling of gangs with large numbers of non-citizens. In addition, sanctuary policies inevitably result in the release of criminal aliens back to the streets where they can and do re-offend. Finally, sanctuary policies can act as a magnet for criminal gangs whose members are in the country illegally, because they know that immigration violations will be overlooked and that their use of fraudulent documents and identities is less likely to be detected.

The practical result of such policies is the release of deportable criminal alien gang members back to the streets of the communities, where they are likely to resume their criminal activities. Acting ICE Director Tom Homan has stated that since January 2014, there have been 10,000 criminal aliens who were released by sanctuaries and who were then subsequently arrested for additional crimes. Homan said that the recidivism rate for released criminal aliens could be as high as 70 percent, which is consistent with the recidivism rate for all offenders in the United States.13

Recommendations. There are a number of steps Congress should take to assist federal and local law enforcement agencies in combating MS-13 and other transnational criminal organizations. Many of these provisions are found in the Secure America's Future Act, introduced by a group of committee chairs in the U.S. House of Representatives.14

These steps include:

  • Update the definition of a criminal gang in federal law, and provide for a designation process to create a bar to the admission of gang members and grounds for their removal. This ensures that the federal government can prevent the entry of known gang members and deny them access to any form of visa, permanent residence, work permit, asylum, or other immigration benefit. Currently, the government must wait for a gang member to commit a crime before disqualifying them from such benefits.
  • Require ICE and the Border Patrol to detain gang members while they are being processed for deportation.
  • Update the law to provide for more serious consequences for sanctuary jurisdictions and the officials who impose sanctuary policies.
  • Revise immigration law to allow DHS more flexibility in dealing with minors and families who are caught after crossing the border illegally.

End Notes

1 Jessica Vaughan and Jon Feere, "Taking Back the Streets: ICE and Local Law Enforcement Target Immigrant Gangs", Center for Immigration Studies, September 30, 2008.

2 Joseph J. Kolb, "Immigration Impunity: Illegal immigrant sponsors of UACs avoid accountability for non-compliance with deportation process", Center for Immigration Studies, February 2017.

3 "President Trump Holds a Law Enforcement Roundtable on MS-13", Latest.com, February 6, 2018.

4 "Texas Gang Threat Assessment", Texas Joint Crime Information Center, Intelligence & Counterterrorism Division, Texas Department of Public Safety, August, 2015.

5 "DPS Releases Texas Gang Threat Assessment", Texas Department of Public Safety, July 25, 2017.

6 Michael E. Miller, "'Vying for control': How MS-13 uses violence and extortion in America's jails", The Washington Post, February 5, 2018.

7 See "Facts and Data" section of the Office of Refugee Resettlement website.

8 See Vaughan and Feere, "Taking Back the Streets".

9 Joseph J. Kolb, "Brentwood, NY Consumed by MS-13 Crime Wave", Center for Immigration Studies, November 3, 2016, and "Immigration Impunity", Center for Immigration Studies, February 17, 2017.

10 J. Weston Phippen, "What Trump Doesn't Understand About MS-13", The Atlantic, June 26, 2017.

11 See the Center for Immigration Studies map and lists of sanctuary jurisdictions here.

12 For more information, see Claude Arnold, "Immigration Authorities and Gang Enforcement", U.S. Attorney's Bulletin 47, May 2006.

13 Acting ICE Director Tom Homan in remarks in Miami, Fla.; see "ICE Director: Sanctuaries 'Pulling their own funding' by disobeying feds", Fox News, August 16, 2017.

14 H.R.4760 - Securing America's Future Act of 2018. Read more about MS-13 Resurgence: Immigration Enforcement Needed to Take Back Our Streets

SOS campaign to be at the Central Oregon Sportsman's Show

Alert date: 
February 17, 2018
Alert body: 

Please join us as we host a booth at the Central Oregon Sportsman's Show in Redmond.  Show runs Thursday, March 1 - Sunday, March 4.

Drop by and say HELLO!


Oregon Department of Corrections: Criminal Alien Report 2017

Evaluation of 12 months of  Oregon Department of Corrections (DOC) Inmate Population Profiles for year 2017 indicated the DOC’s 14 prisons incarcerated an average of 14,696 inmates per day.

Unpublished data obtained from the DOC indicated that from January 1st to December 1st of 2017 there were an average of 972 foreign nationals (criminal aliens) per day incarcerated in the state’s prison system; criminal aliens on a daily basis were 6.62 percent of the total prison population.

The number of criminal aliens in DOC prisons in 2017 increased from 953 alien inmates on January 1st to 973 alien inmates on December 1st, an increase of 20 alien inmates, a 2.10 percent increase in alien inmates for the reporting period.

Some background information, all the criminal aliens incarcerated in the DOC prisons were identified by U.S. Immigration and Customs Enforcement (ICE) and have ICE detainers placed on them.

The following four column table reveals a series of monthly first day or second day snapshots on the number of all DOC inmates, domestic inmates, criminal alien inmates, percentage of inmates who were criminal aliens and averages for all the inmate numbers incarcerated in the state’s prisons in 2017.
 

OREGON DEPARTMENT OF CORRECTIONS

Month/Day/Year

DOC Daily Total Number of All Inmates

DOC Daily Total Number of Domestic Inmates

DOC Daily Total Number of Inmates W/ICE Detainers

DOC Daily Percent of Inmates W/ICE Detainers

January 1, 2017

14,617

13,664

953

6.52%

February 1, 2017

14,594

13,627

967

6.63%

March 1, 2017

14,654

13,680

974

6.65%

April 1, 2017

14,644

13,682

962

6.57%

May 1, 2017

14,691

13,722

969

6.60%

June 1, 2017

14,708

13,727

981

6.67%

July 1, 2017

14,742

13,756

986

6.69%

August 1, 2017

14,722

13,738

984

6.68%

September 1, 2017

14,760

13,789

971

6.58%

October 2, 2017

14,728

13,757

971

6.59%

November 1, 2017

14,752

13,774

978

6.63%

December 1, 2017

14,739

13,766

973

6.60%

Average

14,696

13,724

972

6.62%

Source: Research and Evaluation 12 DOC Report ICE inmate lists 2017 and 12 Inmate Population Profiles 2017.

The number and percentage of criminal aliens sent to DOC prisons from 15 Oregon counties increased from January 1, 2017 to December 1, 2017.

Marion, Washington, Multnomah and Clackamas counties consistently had the majority of criminal aliens incarcerated in DOC prisons.

Using DOC ICE detainer numbers, the following table reveals the total change, increase or decrease, in the number and percentage of criminal alien inmates who were sent to prison from the state’s 36 counties for the time periods of January 1st and December 1st 2017.
 

OREGON DEPARTMENT OF CORRECTIONS

County

DOC Total Inmates W/ ICE Detainers by County Incarcerated on January 1st.

DOC Total Inmates W/ ICE Detainers by County Incarcerated on December 1st.

DOC Total Number Inmates W/ICE Detainers Increase or (Decrease) by County

DOC Total Percent Inmates W/ICE Detainers Increase or (Decrease) by County

Marion

232

235

3

1.29%

Multnomah

201

201

0

0.00%

Washington

187

202

15

8.02%

Clackamas

76

82

6

7.89%

Lane

50

39

(11)

(22.00%)

Jackson

35

37

2

5.71%

Yamhill

22

23

1

4.55%

Umatilla

21

22

1

4.76%

Linn

16

14

(2)

(12.50%)

Klamath

14

15

1

7.14%

Polk

14

16

2

14.29%

Benton

13

15

2

15.38%

Malheur

11

9

(2)

(18.18%)

Deschutes

10

13

3

30.00%

Lincoln

8

7

(1)

(12.50%)

Jefferson

6

5

(1)

(16.67%)

Clatsop

5

4

(1)

(20.00%)

Coos

5

4

(1)

(20.00%)

Josephine

4

5

1

25.00%

Crook

3

1

(2)

(66.67%)

Douglas

3

4

1

33.33%

Tillamook

3

3

0

0.00%

Wasco

3

5

2

66.67%

Hood River

2

4

2

100.00%

Morrow

2

1

(1)

(50.00%)

Union

2

2

0

0.00%

Columbia

1

2

1

100.00%

Gilliam

1

1

0

0.00%

Lake

1

1

0

0.00%

OOS (Not county

1

1

0

0.00%

Sherman

1

0

(1)

(100.00%)

Baker

0

0

0

0.00%

Curry

0

0

0

0.00%

Grant

0

0

0

0.00%

Harney

0

0

0

0.00%

Wallowa

0

0

0

0.00%

Wheeler

0

0

0

0.00%

Total

953

973

20


Source: Research and Evaluation DOC Report ICE inmate lists for 01 January 17 and 01 December 17.

Here are the ways Oregon residents were harmed and victimized by criminal aliens incarcerated in DOC prisons in 2017.

The number and percentage of criminal aliens incarcerated in DOC prisons for the crimes of sex abuse, rape and sodomy increased in 2017.

Again using DOC ICE detainer numbers, the following table reveals the total change, increase or decrease, in the number and percentage of criminal alien inmates incarcerated in the state’s prisons by type of crime for the time periods of January 1st and December 1st 2017.
 

OREGON DEPARTMENT OF CORRECTIONS

Crime

DOC Total Inmates W/ ICE Detainers by Type of Crime on January 1st

DOC Total Inmates W/ ICE Detainers by Type of Crime on December 1st.

DOC Total Number Inmates W/ICE Detainers Increase or (Decrease) by Type of Crime.

DOC Total Percent Inmates W/ICE Detainers Increase or (Decrease) by Type of Crime.

Sex Abuse

185

200

15

8.11%

Rape

170

175

5

2.94%

Homicide

136

136

0

0.00%

Drugs

112

97

(15)

(13.39%)

Sodomy

93

101

8

8.60%

Assault

75

76

1

1.33%

Robbery

54

52

(2)

(3.70%)

Kidnapping

26

25

(1)

(3.85%)

Theft

21

15

(6)

(28.57%)

Burglary

20

23

3

15.00%

Driving Offense

9

7

(2)

(22.22%)

Vehicle Theft

4

5

1

25.00%

Arson

0

0

0

0.00%

Forgery

0

1

1

100.00%

Escape

0

1

1

100.00%

Other / Combination

48

59

11

22.92%

Total

953

973

20


Source: Research and Evaluation DOC Report ICE inmate lists for 01 January 17 and 01 December 17.

On January 1, 2017 criminal aliens from at least 55 countries were listed as being incarcerated in DOC prisons, while on December 1, 2017 criminal aliens from at least 56 countries were listed as being incarcerated in the state’s prisons.

Throughout year 2017 Mexican nationals were the vast majority of criminal aliens incarcerated in DOC prisons.

Once again using DOC ICE detainer numbers, the following table reveals the total change, increase or decrease, in the number and percentage of criminal alien inmates, identifying them by their self-declared countries of origin, who were incarcerated in the state’s prisons for the time periods of January 1st and December 1st 2017.
 

OREGON DEPARTMENT OF CORRECTIONS

Country

DOC Total Inmates W/ ICE Detainers by Self-Declared Country of Origin on January 1st.

DOC Total Inmates W/ ICE Detainers by Self-Declared Country of Origin on December 1st.

DOC Total Number Inmates W/ICE Detainers Increase or (Decrease) by Self-Declared Country of Origin

DOC Total Percent Inmates W/ICE Detainers Increase or (Decrease) by Self-Declared Country of Origin

Mexico

768

777

9

1.17%

Guatemala

20

19

(1)

(5.00%)

El Salvador

14

15

1

7.14%

Cuba

13

17

4

30.77%

Vietnam

13

14

1

7.69%

Honduras

11

14

3

27.27%

Ukraine

10

5

(5)

(50.00%)

Russia

9

9

0

0.00%

FSM 1

7

9

2

28.57%

Cambodia

4

4

0

0.00%

Laos

4

5

1

25.00%

Marshall Islands

4

4

0

0.00%

Philippines

4

4

0

0.00%

Canada

3

3

0

0.00%

Other Countries

69

74

5

7.25%

Total

953

973

20


Source: Research and Evaluation DOC Report ICE inmate lists for 01 January 17 and 01 December 17.
1 Federated States of Micronesia (FSM).

Beyond the DOC criminal alien incarceration numbers and incarceration percentages, per county and per crime type, or even country of origin, criminal aliens pose high economic cost to Oregonians in 2017.

An individual prisoner incarcerated in the DOC prison system costs the state approximately ($94.55) per day.

The DOC’s incarceration cost for an average number of 972 criminal alien inmates incarcerated in the state’s prisons for 2017 was approximately ($91,902.60) per day, ($643,318.20) per week, and ($33,544,449.00) per year.

None of the preceding cost estimates for the DOC to incarcerate criminal aliens includes the dollar amount for legal services (indigent defense), language interpreters, court costs, or victim assistance.

Bibliography

Oregon Department of Corrections Population Profiles for 12 months of 2017:

1 - Oregon Department of Corrections Population Profile January 1, 2017:
http://www.oregon.gov/doc/RESRCH/docs/inmate_profile_201701.pdf

2 - Oregon Department of Corrections Population Profile February 1, 2017:
http://www.oregon.gov/doc/RESRCH/docs/inmate_profile_201702.pdf

3 - Oregon Department of Corrections Population Profile March 1, 2017:
http://www.oregon.gov/doc/RESRCH/docs/inmate_profile_201703.pdf

4 - Oregon Department of Corrections Population Profile April 1, 2017:
http://www.oregon.gov/doc/RESRCH/docs/inmate_profile_201704.pdf

5 - Oregon Department of Corrections Population Profile May 1, 2017:
http://www.oregon.gov/doc/RESRCH/docs/inmate_profile_201705.pdf

6 - Oregon Department of Corrections Population Profile June 1, 2017:
http://www.oregon.gov/doc/RESRCH/docs/inmate_profile_201706.pdf

7 - Oregon Department of Corrections Population Profile July 1, 2017:
http://www.oregon.gov/doc/RESRCH/docs/inmate_profile_201707.pdf

8 - Oregon Department of Corrections Population Profile August 1, 2017:
http://www.oregon.gov/doc/RESRCH/docs/inmate_profile_201708.pdf

9 - Oregon Department of Corrections Population Profile September 1, 2017:
http://www.oregon.gov/doc/RESRCH/docs/inmate_profile_201709.pdf

10 - Oregon Department of Corrections Population Profile October 2, 2017:
http://www.oregon.gov/doc/RESRCH/docs/inmate_profile_201710.pdf

11 - Oregon Department of Corrections Population Profile November 1, 2017:
http://www.oregon.gov/doc/RESRCH/docs/inmate_profile_201711.pdf

12 - Oregon Department of Corrections Population Profile December 1, 2017:
http://www.oregon.gov/doc/RESRCH/docs/inmate_profile_201712.pdf

Oregon Department of Corrections unpublished criminal alien data for 12 months of 2017:

1 - Oregon Department of Corrections Population Profile (unpublished MS Excel workbook) titled Incarcerated Criminal Aliens Report dated January 1, 2017.

2 - Oregon Department of Corrections Population Profile (unpublished MS Excel workbook) titled Incarcerated Criminal Aliens Report dated February 1, 2017.

3 - Oregon Department of Corrections Population Profile (unpublished MS Excel workbook) titled Incarcerated Criminal Aliens Report dated March 1, 2017.

4 - Oregon Department of Corrections Population Profile (unpublished MS Excel workbook) titled Incarcerated Criminal Aliens Report dated April 1, 2017.

5 - Oregon Department of Corrections Population Profile (unpublished MS Excel workbook) titled Incarcerated Criminal Aliens Report dated May 1, 2017.

6 - Oregon Department of Corrections Population Profile (unpublished MS Excel workbook) titled Incarcerated Criminal Aliens Report dated June 1, 2017.

7 - Oregon Department of Corrections Population Profile (unpublished MS Excel workbook) titled Incarcerated Criminal Aliens Report dated July 1, 2017.

8 - Oregon Department of Corrections Population Profile (unpublished MS Excel workbook) titled Incarcerated Criminal Aliens Report dated August 1, 2017.

9 - Oregon Department of Corrections Population Profile (unpublished MS Excel workbook) titled Incarcerated Criminal Aliens Report dated September 1, 2017.

10 - Oregon Department of Corrections Population Profile (unpublished MS Excel workbook) titled Incarcerated Criminal Aliens Report dated October 2, 2017.

11 - Oregon Department of Corrections Population Profile (unpublished MS Excel workbook) titled Incarcerated Criminal Aliens Report dated November 1, 2017.

12 - Oregon Department of Corrections Population Profile (unpublished MS Excel workbook) titled Incarcerated Criminal Aliens Report dated December 1, 2017.

Oregon Department of Corrections Issue Brief Quick Facts IB-53, January, 2017:
http://www.oregon.gov/doc/OC/docs/pdf/IB-53-Quick%20Facts.pdf

David Olen Cross of Salem, Oregon writes on immigration issues and foreign national crime. This report is a service to Oregon state, county and city governmental officials to help them assess the impact of foreign national crime in the state. He can be reached at docfnc@yahoo.com or at http://docfnc.wordpress.com/


  Read more about Oregon Department of Corrections: Criminal Alien Report 2017

Suspect accused of sexually assaulting 9-year-old girl was deported 16 years ago


Santiago Martinez-Flores - Photo from the Clackamas County Sheriff's Office{&nbsp;}

A man who was deported to Mexico 16 years ago has been convicted of sexually assaulting a 9-year-old Oregon girl while she slept in her bedroom last year.

The girl's mother told KATU News her 9-year-old and 5-year-old daughters were asleep on the night of Feb. 26 at the Clackamas Trails Apartments when a stranger broke into their bedroom through a window.

After being pinned down by the stranger, the girl managed to escape and run to her mom's room. When they realized what happened, the girl's dad took his gun and went into the bedroom, but the suspect had already escaped through the window.

Deputies were able to find the suspect's fingerprints, the mom told KATU. The little girl was able to recall what her attacker looked like, and helped deputies create a sketch of what he looked like.

Santiago Martinez-Flores, 48, was quickly identified as the suspect in the attack. He was arrested about two months after the attack at the California and Mexico border, about 15 miles from San Diego.

READ MORE: Suspect accused of sexually assaulting 9-year-old girl was deported 16 years ago

Martinez-Flores was charged with unlawful sexual penetration, sex abuse, attempted rape and burglary. He was found guilty Friday, and will be sentenced Monday.

Martinez-Flores has a lengthy criminal history that dates back to 1994. He was deported to Mexico in 2001 after serving two years in the Oregon Department of Corrections.

  Read more about Suspect accused of sexually assaulting 9-year-old girl was deported 16 years ago

U.S. Federal Bureau of Prisons: Criminal Alien Report December 2017

The United States having a significant foreign national population residing within the nations boundaries, be they legally or illegally present in the country, unfortunately includes those who commit crimes.

The extent and impact of foreign national crime on the U.S. citizens and residents of this country is explicitly revealed by a simple search on the U.S. Federal Bureau of Prisons (BOP) inmates statistics website under the heading of inmate citizenship.

Here are the countries of origin, moreover, the number and percentage of those countries citizens recently incarcerated in the U.S. BOP prison system (The most recent BOP crime numbers available were from December 30, 2017.).

Inmate Citizenship:

- México 23,805 inmates, 13.0 percent;
- Colombia 1,683 inmates, 0.9 percent;
- Dominican Republic 1,443 inmates, 0.8 percent;
- Cuba 1,196 inmates, 0.7 percent;
- Other / unknown countries 9,080 inmates, 4.9 percent;
- United States 145,851 inmates, 79.7 percent;

Total Inmates: 183,058 inmates.

To clarify the meaning of these preceding criminal alien inmate numbers and percentages, I will translate them into words:

Combining December 30th BOP criminal alien inmate numbers, there were 37,207 criminal aliens in the BOP prison system. Alien inmates were 20.3 percent of the federal prison population; more than two in every ten inmates were criminal aliens.

With 23,805 Mexican nationals being incarcerated in the BOP prison system, at 64.0 percent, they were the vast majority of criminal aliens in federal prisons.

The U.S. Federal Bureau of Prisons breaks down the federal prison population into 13 types of offenses. One of the top five offenses, the reason inmates are serving time in federal prisons is for immigration crimes. There were 12,246 inmates in the BOP prison system incarcerated for immigration crimes; they were 7.1 percent of the federal prison population.

An urgent wakeup call to all American citizens, eventually the majority of these criminal aliens from México, Colombia, Dominican Republic, Cuba and other countries will be released from the U.S. Federal Bureau of Prisons after completing their prison terms.

The country of Mexico, America’s neighbor to the south, is both historically and literally a land bridge of many frequently unsecured trails, roads, highways and railways used by persons trying and far too often successfully illegally entering our country.

United States citizens should, if they haven’t already, contact their members of the U.S. Congress (two Senators and one Representative) and tell them to support President Donald J. Trump’s commitment to build a wall (fences and technology) along the U.S. border with Mexico to stop the threat of tens of thousands of criminal aliens, once they are released from the federal prison system and deported by U.S. Immigration and Customs Enforcement to their countries of origin, ability to illegally return to this nation and harm its citizens and residents.

David Olen Cross of Salem, Oregon is an independent crime researcher who writes on immigration issues and foreign national crime. He is a weekly guest on the Lars Larson northwest radio show. He can be reached at docfnc@yahoo.com or at http://docfnc.wordpress.com/ Read more about U.S. Federal Bureau of Prisons: Criminal Alien Report December 2017

Oregon Department of Corrections: Foreign National Drug Crime Report December 2017

Information obtained from the Oregon Department of Corrections (DOC) indicated that on December 1, 2017 that 97 of the 973 foreign nationals (criminal aliens) in the state’s prison system were incarcerated for drug crimes, 9.97 percent of the criminal alien prison population.

Using DOC U.S. Immigration and Customs Enforcement (ICE) immigration detainer numbers, the following table reveals the total number criminal alien inmates along with the number and percentage of those alien inmates incarcerated on December 1st in the state’s prisons for drug crimes.
 

OREGON DEPARTMENT OF CORRECTIONS

Month/Day/Year

DOC Total Inmates W/ICE Detainers

DOC Number of Inmates W/ICE Detainers for Drug Crimes

DOC Percent of Inmates W/ICE Detainers for Drug Crimes

December 1, 2017

973

97

9.97%

Source: Research and Evaluation DOC Report ICE inmates list 01 December 17.

Using DOC ICE immigration detainer numbers, the following table reveals the number and percentage of criminal alien inmates incarcerated on December 1st that were sent to prison from the state’s 36 counties for drug crimes.
 

OREGON DEPARTMENT OF CORRECTIONS

County

DOC Number of Inmates W/ ICE Detainers by County Incarcerated for Drug Crimes

DOC Percent of Inmates W/ ICE Detainers by County Incarcerated for Drug Crimes

Multnomah

33

34.02%

Washington

18

18.56%

Clackamas

14

14.43%

Jackson

7

7.22%

Marion

7

7.22%

Klamath

3

3.09%

Benton

2

2.06%

Lane

2

2.06%

Malheur

2

2.06%

Umatilla

2

2.06%

Wasco

2

2.06%

Deschutes

1

1.03%

Douglas

1

1.03%

Josephine

1

1.03%

Lake

1

1.03%

Polk

1

1.03%

Baker

0

0.00%

Clatsop

0

0.00%

Columbia

0

0.00%

Coos

0

0.00%

Crook

0

0.00%

Curry

0

0.00%

Gilliam

0

0.00%

Grant

0

0.00%

Harney

0

0.00%

Hood River

0

0.00%

Jefferson

0

0.00%

Lincoln

0

0.00%

Linn

0

0.00%

Morrow

0

0.00%

OOS (Not a County)

0

0.00%

Sherman

0

0.00%

Tillamook

0

0.00%

Union

0

0.00%

Wallowa

0

0.00%

Wheeler

0

0.00%

Yamhill

0

0.00%

Total

97

100.00%

Source: Research and Evaluation DOC Report ICE inmates list 01 December 17.

Using DOC ICE immigration detainer numbers, the following table reveals the self-declared countries of origin of the 97 criminal alien inmates by number and percentage incarcerated on December 1st in the state’s prisons for drug crimes.
 

OREGON DEPARTMENT OF CORRECTIONS

Country

DOC Number of Inmates W/ ICE Detainers by Country Incarcerated for Drug Crimes

DOC Percent of Inmates W/ ICE Detainers by Country Incarcerated for Drug Crimes


Mexico

85

87.63%


Honduras

4

4.12%


El Salvador

2

2.06%


Australia

1

1.03%


Italy

1

1.03%


Laos

1

1.03%


Russia

1

1.03%


Unknown Countries

2

2.06%


Total

97

100.00%


Source: Research and Evaluation DOC Report ICE inmates list 01 December 17.

Criminal aliens from seven different countries have committed drug crimes against residents in the State of Oregon.

David Olen Cross of Salem, Oregon writes on immigration issues and foreign national crime. This report is a service to Oregon state, county and city governmental officials to help them assess the impact of foreign national crime in the state. He can be reached at docfnc@yahoo.com or at http://docfnc.wordpress.com/ Read more about Oregon Department of Corrections: Foreign National Drug Crime Report December 2017

Justice Department Demands Documents and Threatens to Subpoena 23 Jurisdictions As Part of 8 U.S.C. 1373 Compliance Review

The Department of Justice today sent the attached letters to 23 jurisdictions, demanding the production of documents that could show whether each jurisdiction is unlawfully restricting information sharing by its law enforcement officers with federal immigration authorities.

All 23 of these jurisdictions were previously contacted by the Justice Department, when the Department raised concerns about laws, policies, or practices that may violate 8 U.S.C. 1373, a federal statute that promotes information sharing related to immigration enforcement and with which compliance is a condition of FY2016 and FY2017 Byrne JAG awards.

The letters also state that recipient jurisdictions that fail to respond, fail to respond completely, or fail to respond in a timely manner will be subject to a Department of Justice subpoena.

“I continue to urge all jurisdictions under review to reconsider policies that place the safety of their communities and their residents at risk,” said Attorney General Jeff Sessions. “Protecting criminal aliens from federal immigration authorities defies common sense and undermines the rule of law. We have seen too many examples of the threat to public safety represented by jurisdictions that actively thwart the federal government’s immigration enforcement—enough is enough.”

Failure to comply with section 1373 could result in the Justice Department seeking the return of FY2016 grants, requiring additional conditions for receipt of any FY2017 Byrne JAG funding, and/or jurisdictions being deemed ineligible to receive FY2017 Byrne JAG funding.

The following jurisdictions received the document request today:

  • Chicago, Illinois;
  • Cook County, Illinois;
  • New York City, New York;
  • State of California;
  • Albany, New York;
  • Berkeley, California;
  • Bernalillo County, New Mexico;
  • Burlington, Vermont;
  • City and County of Denver, Colorado;
  • Fremont, California;
  • Jackson, Mississippi;
  • King County, Washington;
  • Lawrence, Massachusetts;
  • City of Los Angeles, California;
  • Louisville Metro, Kentucky;
  • Monterey County, California;
  • Sacramento County, California;
  • City and County of San Francisco, California;
  • Sonoma County, California;
  • Watsonville, California;
  • West Palm Beach, Florida;
  • State of Illinois; and
  • State of Oregon.

Pages

Subscribe to RSS - crime